
Figure 1. Survival curves of time-to-hemorrhage in patients with untreated brain AVM, by MARS cohort.
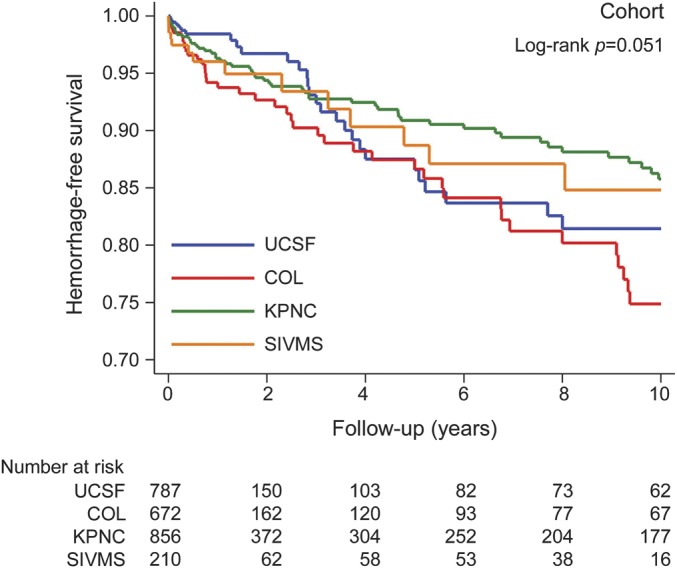
The y-axis shows the proportion of subjects who remain hemorrhage-free. The x-axis shows follow-up time after AVM diagnosis in years. The table below shows the number at risk at each follow-up time interval. AVM = arteriovenous malformation; COL = Columbia; KPNC = Kaiser Permanente of Northern California; MARS = Multicenter AVM Research Study; SIVMS = Scottish Intracranial Vascular Malformation Study; UCSF = University of California San Francisco.