
Figure. Cumulative incidence of idiopathic Parkinson disease (A) and LRRK2 p.G2019S parkinsonism (B).
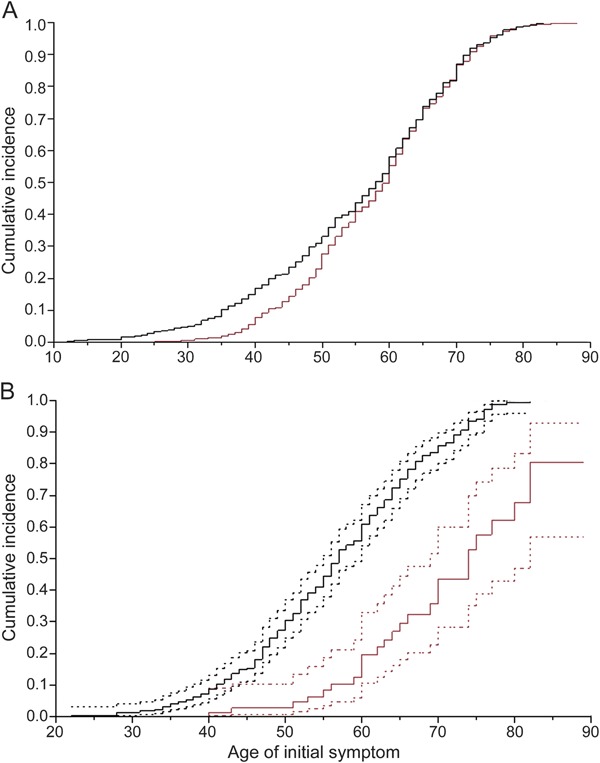
Kaplan-Meier analysis of parkinsonism with age at onset as the time variable. Black lines represent Tunisia and red lines represent Norway. Dotted lines represent confidence intervals. Unaffected LRRK2 p.G2019S carriers were right-censored.