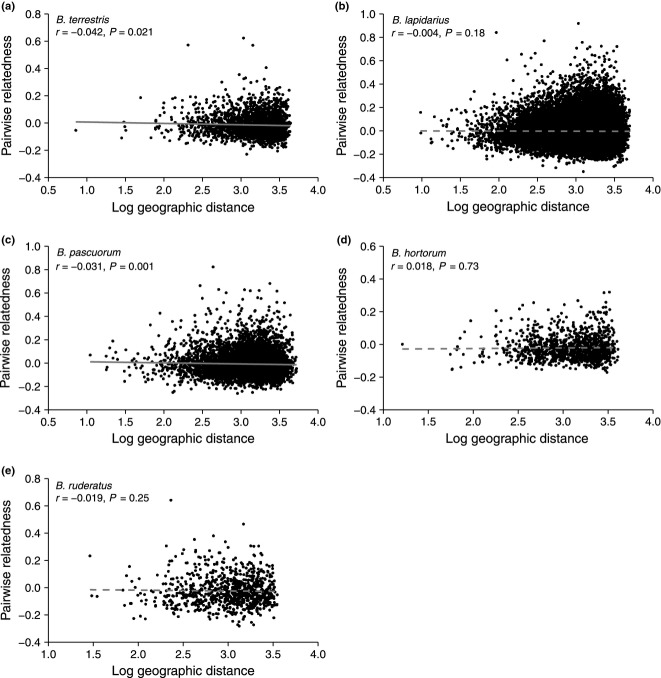
Fig. 2.
Relationship between pairwise relatedness of colony queens (whose genotypes were reconstructed from worker sibships) and geographic distance (log.10-transformed distance in metres) between colonies in populations of (a) Bombus terrestris, (b) B. lapidarius, (c) B. pascuorum, (d) B. hortorum and (e) B. ruderatus in the study landscape. Results of the Mantel tests are reported on the plots. Plain and dashed lines represent significant and nonsignificant correlations, respectively. Regression equations: B. terrestris, y = −0.0101x + 0.0172, B. lapidarius, y = −0.0014x + 0.0006, B. pascuorum, y = −0.0093x + 0.0207, B. hortorum, y = 0.0037x – 0.0326 and B. ruderatus, y = −0.0059x – 0.0068. Sample sizes (no. of reconstructed queen genotypes) are as in Table 2.

