
Figure 1.
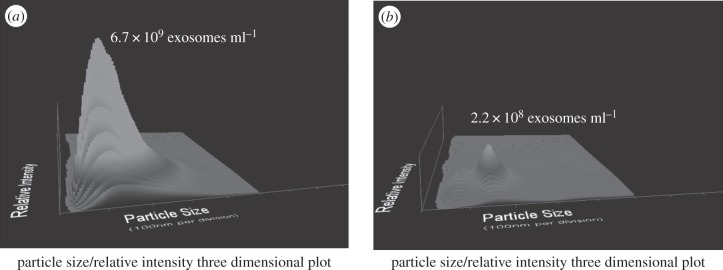
Quantification of brain-derived exosomes in the circulation of a patient with brain cancer. Following chromatographic isolation, circulating exosomes were quantified using a NanoSight NS300. The x-axis presents the size range of observed vesicles, the y-axis the concentration of vesicles and the z-axis the relative intensity. Panel (a) shows the circulating total exosome population, defined by the NS300 in light scatter mode. Panel (b) identifies those vesicles expressing a marker of brain-derived exosomes (β-amyloid), determined using the NS300 in fluorescent mode.