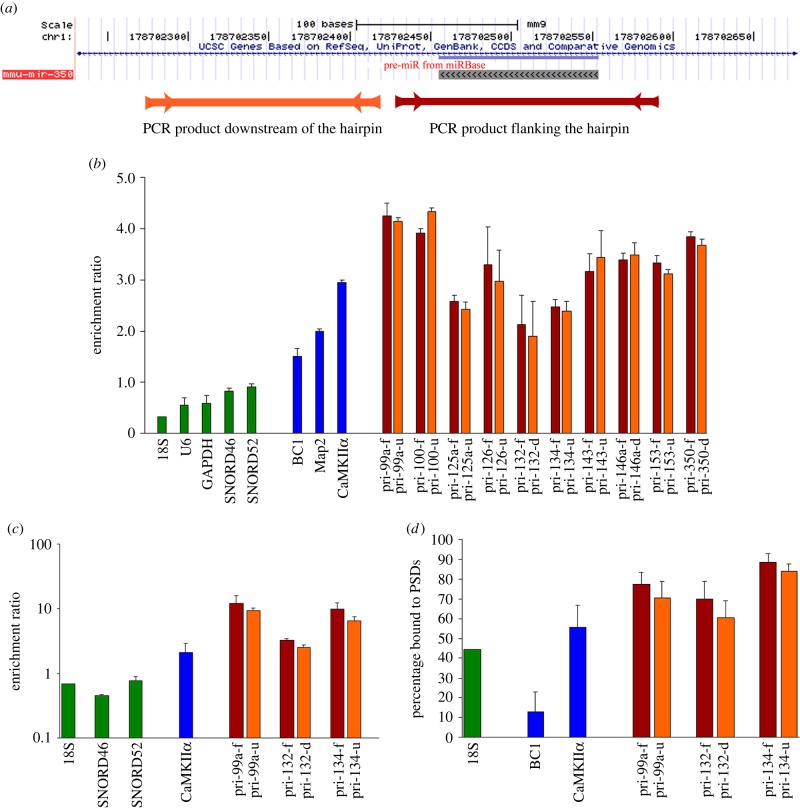
Figure 1.
Pri-miRs are enriched within synaptoneurosomes, synaptosomes and isolated PSDs. (a) Diagram showing the genomic position of pre-miR-350 in the UCSC Genome Browser, indicating the PCR products flanking the hairpin (Bordeaux (darker) bar) and downstream of the hairpin (orange (lighter) bar). (b) Enrichment ratio (synaptoneurosomes/total homogenate) of various RNAs as measured by qRT-PCR. (c) Enrichment ratio (synaptosome/total homogenate) of intergenic pri-miRNAs measured by qRT-PCR. Note the log scale. (d) Distribution of pri-miRNAs and control RNAs in synaptosomes (soluble versus PSD fractions). Synaptosomes (Syn) were lysed with 1% Triton X-100 to yield soluble (Sol) and insoluble fractions (PSD). (b–d) Housekeeping RNAs and known synaptic RNAs are indicated by green bars. PCR products flanking the hairpin are indicated by Bordeaux (darker) bars and the PCR products either downstream or upstream of the hairpin are indicated by orange (lighter) bars. Data represent the geometric mean of three independent preparations (±s.e.m.). To minimize differences across preparations, values were normalized to 18S using the delta-delta ΔΔCt method. Reprinted from [28] with permission. (Online version in colour.)

