
Figure 1.
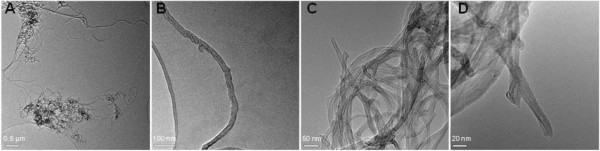
TEM pictures of MWCNT. Agglomerates (A), single nanotubes (B), and tubes sticking out of the agglomerates (C, D) visualized by transmission electron micrographs of sonicated MWCNT in distilled water.
Official websites use .gov
A
.gov website belongs to an official
government organization in the United States.
Secure .gov websites use HTTPS
A lock (
) or https:// means you've safely
connected to the .gov website. Share sensitive
information only on official, secure websites.
TEM pictures of MWCNT. Agglomerates (A), single nanotubes (B), and tubes sticking out of the agglomerates (C, D) visualized by transmission electron micrographs of sonicated MWCNT in distilled water.