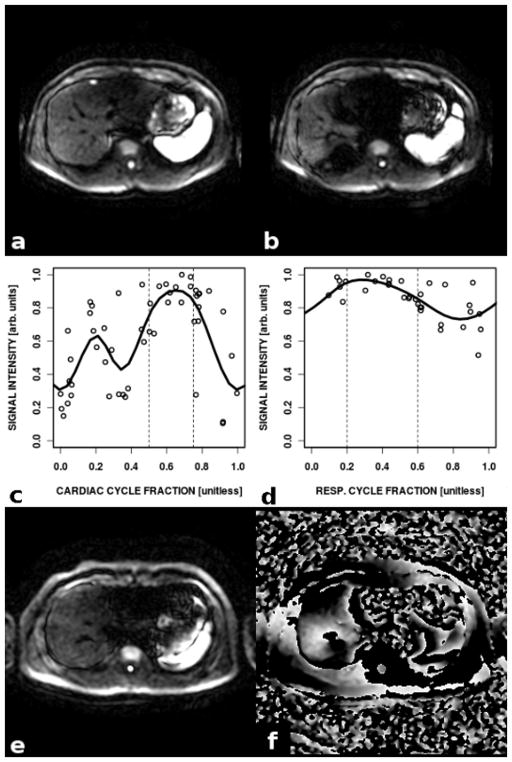
Figure 1. Signal dropout from bulk motion in DW-SE-EPI.
Diffusion weighted images of liver are affected by signal dropout from bulk motion at specific times in the cardiac and respiratory cycles. In (a, b), two single shot images acquired at the same b-value (b=500 s/mm2) and slice, but at different times in the scan, are shown. The entire left lobe of the liver, a portion of the right lobe, and most of a small focal lesion are greatly attenuated in (b) relative to (a). In (c, d), variation of signal intensity at a single b-value (b=500 s/mm2) is shown for an ROI in the left lobe (c) and for an ROI in the right lobe (d). Signal intensity is plotted versus the time during the cardiac and respiratory cycles at which the image was acquired (defined as ratio of retrospective trigger delay to trigger interval, for peripheral pulse monitor and respiratory bellows monitor respectively). Trendlines (cyclic cubic splines through centroids of 7 bins) are shown (curves). Gating thresholds, within which signal was maximal and change was minimal, are indicated (vertical dashed lines, cardiac: 0.5–0.75, respiratory: 0.2–0.6). In (e, f), magnitude and phase of a diffusion weighted image (b=500 s/mm2) are shown. There is rapid change in phase (f) as the region of signal dropout in the left lobe is approached (e). This suggests a mechanism of attenuation other than diffusion, which causes no net phase.

