
Figure 5. Diffusivity maps in two patients with focal liver lesions.
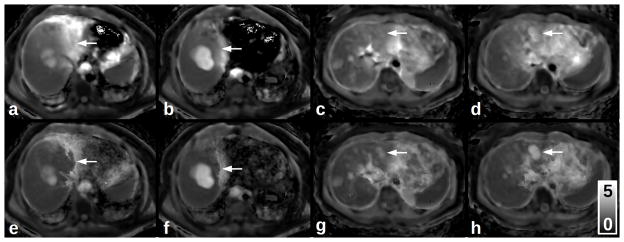
LS (a, b, c, d) and BLN (e, f, g, h) error models were used to generate parametric maps of D without gating in two patients with focal liver lesions. Two contiguous slices are shown for each patient. The first patient (a, b, e, f) had a 5 cm cyst in the right liver lobe. The second patient (c, d, g, h) had multiple lesions, including two 1 cm cysts in the left liver lobe. In the LS maps, diffusivity is artifactually elevated in the liver parenchyma to the left of each lesion (arrows), reducing contrast between lesion and parenchyma, and potentially leading to incorrect classification of the lesion as benign or malignant. This effect occurs because of signal dropout from cardiac motion, and is mitigated in the BLN maps. Window and level settings are the same for all images. Units for gray-scale bars are 1E-3 mm2/s.