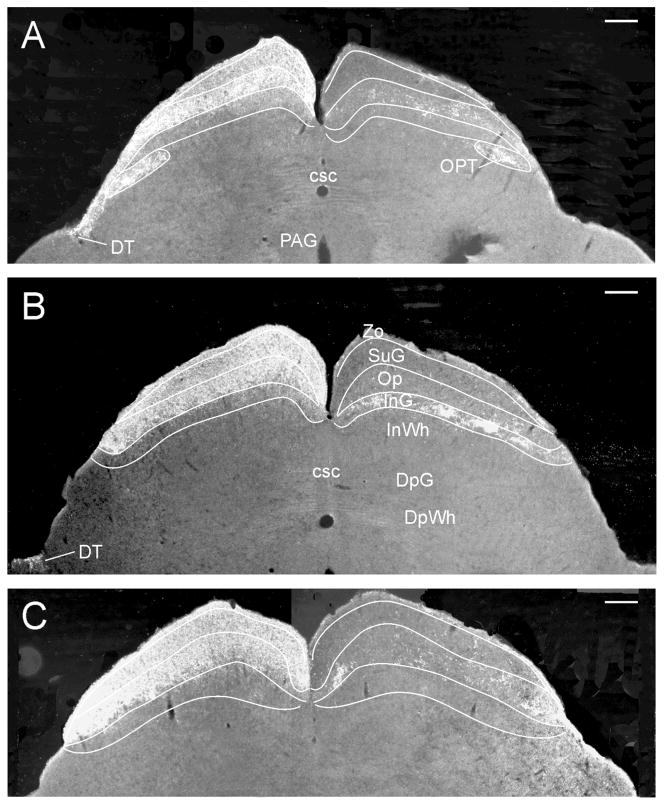
Figure 7.
Darkfield photomicrographs showing retinal innervation in several layers of the mouse superior colliculus. (A–C) Images are from consecutively mounted tissue sections corresponding to the levels shown in Fig. 1M, mm and N (about 60 μm apart). “Patches” of terminals are evident in the ipsilateral mouse Op (A–C), but also in one level (B) of the ipsilateral InG. Bars = 200 μm.

