
Figure 5. Expression of GHSR mRNA within FACS-separated eGFP-enriched and eGFP-negative hippocampal neurons.
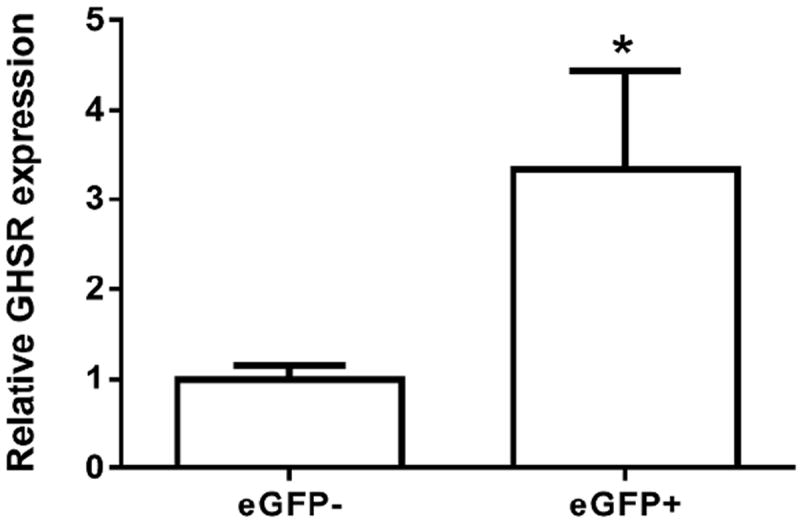
Relative GHSR mRNA expression in the FACS-separated pools was determined by qRT-PCR, normalized to expression of the housekeeping gene cyclophilin and mathematically adjusted to the lowest expressed level, set as one (ΔΔCT method). Values are expressed as mean ± S.E, n=4 independent experiments. *p<0.05, significant change in GHSR mRNA expression. Data was analyzed by student’s “t” test.