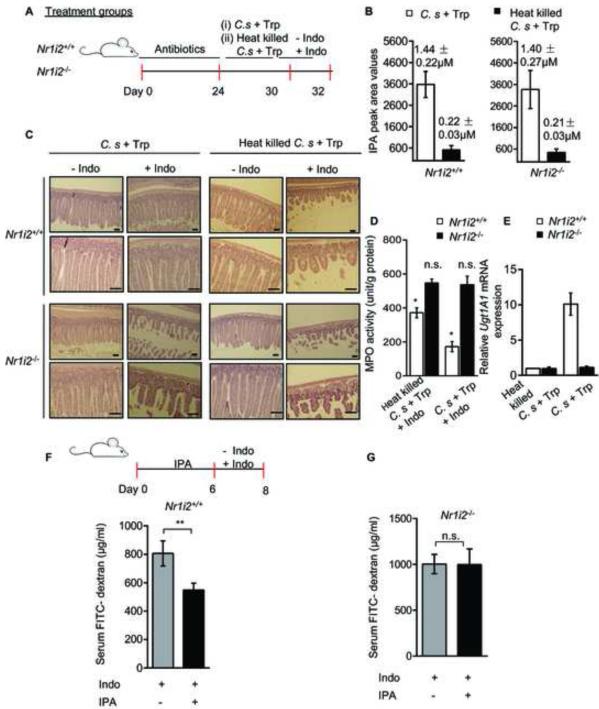
Figure 2. Commensal C. sporogenes reconstitution decreases intestinal permeability and inflammation in a PXR-dependent manner in mice.
(A) Schematic of commensal depletion and C. sporogenes reconstitution experiment in Nr1i2+/+ and Nr1i2−/− mice (see Experimental Procedures).
(B) Plasma IPA peak area intensity values plotted by treatment groups as illustrated in the schema (A). The IPA concentrations in micromoles (μM) pertaining to each group is illustrated above each histogram.
(C) Hematoxylin and eosin staining of C. sporogenes + L-tryptophan and Heat killed C. sporogenes + L-tryptophan exposed Nr1i2+/+ and Nr1i2−/− mice jejunum cross-sections in accordance with schema (A). Scale bars, 50 μm.
(D) Jejunal MPO activity (unit/g of total protein) in treatment groups from schema (A) as illustrated.
(E) Real-time qPCR analysis of Ugt1a1 mRNA expression in small intestinal mucosa from schema (A).
(F and G) Serum FITC-dextran recovery following oral gavage of IPA (20 mg/kg/day) and indomethacin (see schematic) in (F) Nr1i2+/+ (n = 9) and (G) Nr1i2−/− (n = 9) mice.
All graphs show mean values ± s.e.m. *P ≤ 0.01 (Two-way ANOVA with Sidak’s multiple comparison test); (n=6 per group). **P ≤ 0.01 (Student’s t-test); n.s. not significant. Also see Figure S2 and Table S2

