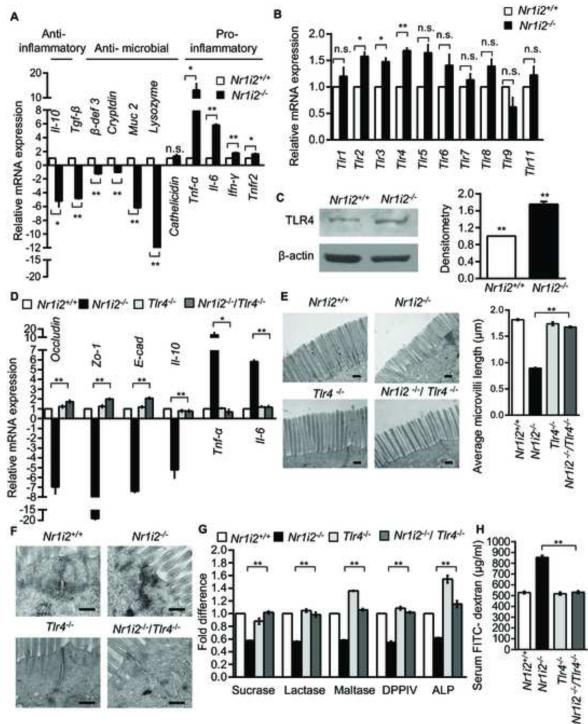
Figure 5. Small intestine epithelial barrier dysfunction in Nr1i2−/− mice requires TLR4 expression and signaling.
(A and B) Real-time qPCR analysis of (A) anti-inflammatory, anti-microbial, pro-inflammatory and (B) Tlr gene expression in Nr1i2+/+ and Nr1i2−/− mice jejunum villi enterocytes (n=8-10 per group). Data plotted as fold change in Nr1i2−/− mice relative to mRNA levels in Nr1i2+/+ mice.
(C) Immunoblot shows increased expression of TLR4 in Nr1i2−/− mice (n=6 per group) (left). Immunoblots are representative of three independent experiments. Quantitation of band density was performed with two blots each with three different exposure times (right).
(D) Real - time qPCR analysis of key regulatory genes of epithelial barrier function in Nr1i2+/+, Nr1i2−/−, Tlr4−/− and Nr1i2−/− /Tlr4−/− mice jejunum villi enterocytes (n=8-10 per group).
(E) Representative TEM images of Nr1i2+/+, Nr1i2−/−, Tlr4−/− and Nr1i2−/− / Tlr4−/− mice jejunum showing microvilli (left) and quantitation of average microvillus length (right).
(F) Representative TEM images of Nr1i2+/+, Nr1i2−/−, Tlr4−/− and Nr1i2−/− / Tlr4−/− mice jejunum showing cell-cell junctional complex.
(G) Enzyme (as denoted) activity assays performed with jejunal villi enterocyte homogenate from Nr1i2+/+, Nr1i2−/−, Tlr4−/− and Nr1i2−/− /Tlr4−/− mice. Data are expressed as fold change relative to Nr1i2+/+ mice.
(H) Serum FITC-dextran levels in Nr1i2+/+, Nr1i2−/−, Tlr4−/− and Nr1i2−/− /Tlr4−/− mice (n=8-10 per group). All graphs show mean values ± s.e.m. *P ≤ 0.05; **P ≤ 0.01; n.s. not significant (A,B,D,E,G,H) (Two-way ANOVA with Tukey’s multiple comparison test); (C) Student t-test. Scale bars: E and F, 0.5 μm. Also see Figure S5.

