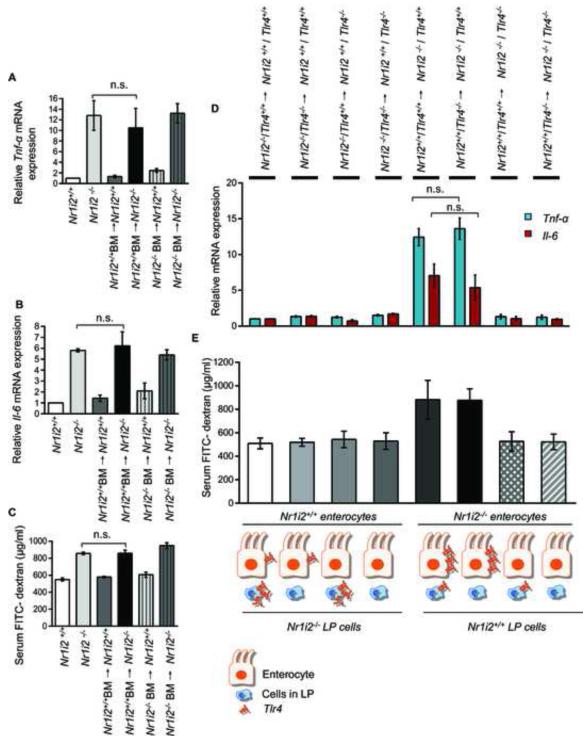
Figure 7. Epithelial barrier defects in Nr1i2−/− mice small intestine is dependent on non-hematopoietic (epithelium) compartment.
(A and B) Real-time qPCR analysis of pro-inflammatory markers (A) Tnf-α and (B) Il-6 was assessed in Nr1i2+/+ (n=10), Nr1i2−/− (n=10), Nr1i2+/+ BM→ Nr1i2+/+ (n=9), Nr1i2+/+ BM→ Nr1i2−/− (n=9), Nr1i2−/− BM→ Nr1i2+/+ (n=6) and Nr1i2−/− BM→ Nr1i2−/− (n=5) mice jejunal villi enterocytes. Data are expressed as fold change in all mice groups compared to Nr1i2+/+ mice.
(C) In vivo FITC-dextran permeability assay was performed in Nr1i2+/+ (n=10 mice), Nr1i2−/− (n=10), Nr1i2+/+ BM→ Nr1i2+/+ (n=9), Nr1i2+/+ BM→ Nr1i2−/− (n=9), Nr1i2−/− BM→ Nr1i2+/+ (n=6) and Nr1i2−/− BM→ Nr1i2−/− (n=5) mice.
(D) Real-time PCR analysis of proinflammatory markers (blue) Tnf-α and (red) Il-6 was assessed in genotypes illustrated (n=5) mice jejunal mucosa. Data are expressed as fold change in all mice groups compared to Nr1i2−/− /Tlr4+/+→ Nr1i2+/+ /Tlr4+/+ mice.
(E) In vivo FITC-dextran permeability assay was performed in (n=5) mice jejunal mucosa.
All graphs show mean values ± s.e.m.; n.s. not significant (Two-way ANOVA with Tukey’s multiple comparison test).

