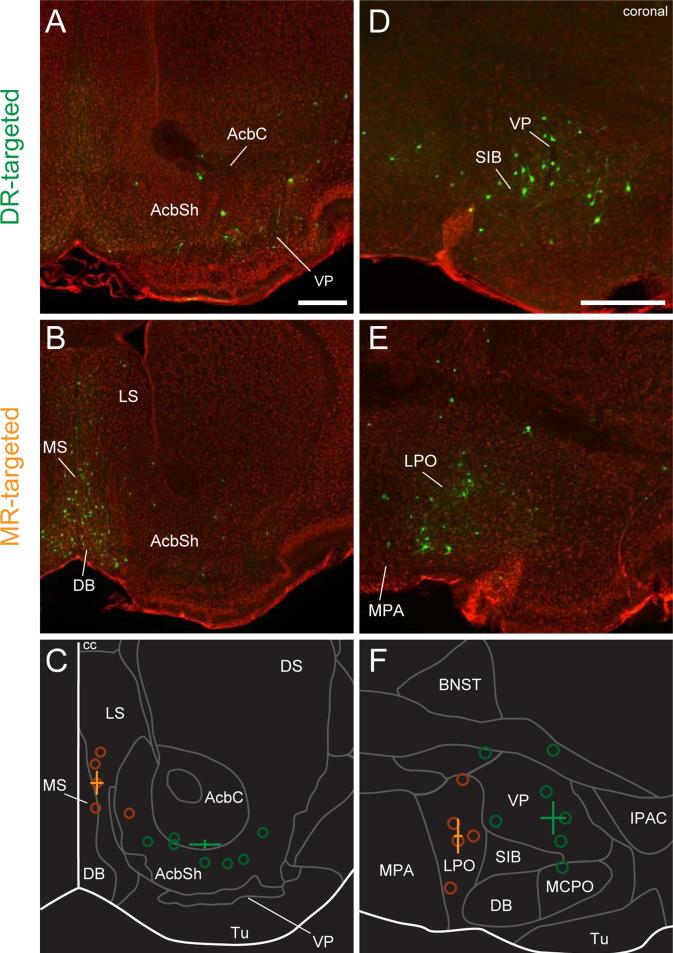
Figure 3. Spatial shift of input areas for DR and MR serotonin neurons in the forebrain.
(A-C) Septal and striatal areas. (A) DR-targeted. (B) MR-targeted. Green, rv-EGFP; Red, fluorescent Nissl staining. (C) The median of the coordinatesof all input neurons. Open circles indicate the medians from individual animals. Crosses indicate the mean±SEMof medians in DR- or MR-targeted groups (n=7 and 5 mice for DR and MR groups, respectively). Green, DR targeted; orange, MR-targeted. Scale bar, 0.5 mm.Bregma:1.1 mm.
(D-F) Pallidal and hypothalamic areas. (D) DR-targeted. (E) MR-targeted. Same conventions as (A) through (C).Bregma: 0.14 mm.
Abbreviations as in Figure 1; AcbC, nucleus accumbens core; AcbSh, nucleus accumbens shell; cc, corpus callosum; Tu, olfactory tubercle; MPA, medial preoptic nucleus; SIB, substantiainnominata basal part; MCPO, magnocellularpreoptic nucleus; IPAC, interstitial nucleus of the posterior limb of the anterior commissure.

