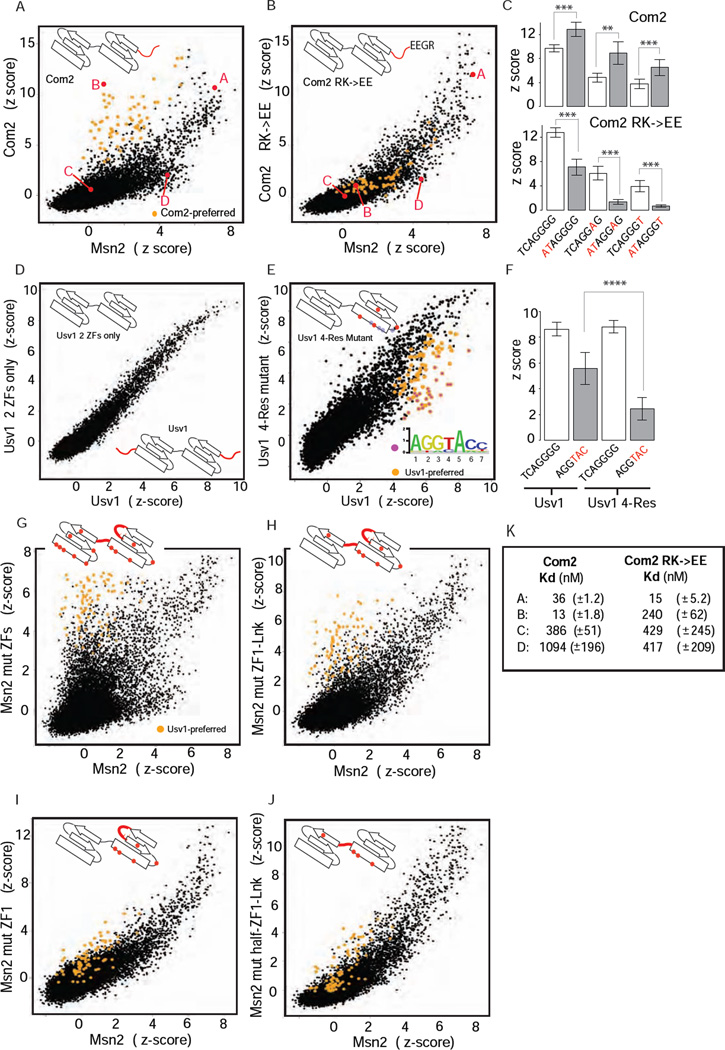
Figure 2. Binding specificities of ZF mutants.
(A), (B) Binding profile comparisons (as in Figure 1) for Com2 and Com2 RK→EE mutant relative to Msn2. Com2-preferred sites (as in Figure 1B) are highlighted (orange). 8-bp sequences (labeled A, B, C and D) assayed in EMSAs are in red. (C) Comparison of Com2 and Com2 RK→EE mutant binding to select binding sites. DNA base differences from the common site TCAGGGG (Figure 1D) are in red. Scores are mean z-scores for the eight different 8-mers containing the 7-mer sites shown (error bars = 1 standard deviation (SD)). (**) P < 10−3, (***) P < 10−4, unpaired Student’s t-test (D), (E) Binding profile comparisons for Usv1 two-ZF and 4-Res mutants shown relative to Usv1. Usv1-preferred sites (as in Figure 1D) are highlighted (orange); the subset of sites preferentially bound by Usv1 relative to Usv1 4-Res mutant are highlighted (magenta). Approximate positions of canonical recognition residues (grey dots) and mutated residues (red dots) are illustrated in ZF cartoons. (F) Comparison of Usv1 and Usv1 4-Res mutant binding to two binding sequences: (i) TCAGGGG common site (Figure 1D), and (ii) AGGTAC – a Usv1-preferred site (Figure 1D) that was bound poorly by Usv1 4-Res mutant. Scores are mean z-scores for the eight different 8-mers containing TCAGGGG (columns 1 and 3) and for the 48 different 8-mers containing AGGTAC (columns 2 and 4) (error bars = 1 SD). (****) P < 10−15, unpaired t-test. (G)–(J) Binding specificities of Msn2 wild-type and mutant proteins. Binding profile comparison for Msn2 mutants relative to Msn2. Usv1-preferred sites (as in Figure1D) are highlighted (orange). (K) Dissociation binding constants (mean and standard deviation) for Com2 (as in Figure 1E, for comparison) and Com2 RK→EE mutant to select DNA sequences are listed. Probe sequences are as in Figure 1E.

