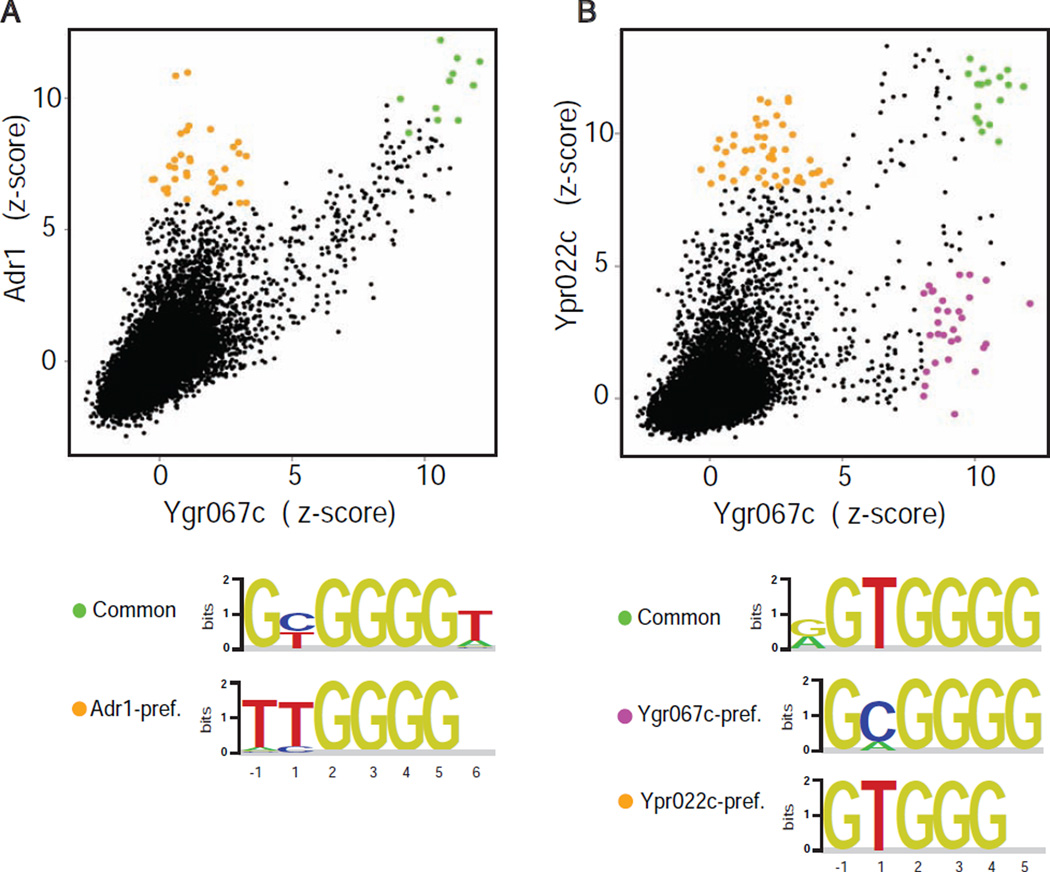
Figure 3. Binding specificity for Adr1 specificity group proteins.
(A)–(B) Pairwise binding profile comparisons for Adr1 and Ypr022C relative to Ygr067c. Z-scores are as in Figure 1B,C. Common and TF-preferred sites are highlighted. Binding motifs are shown for highlighted TF-preferred and common sites (base numbering as in Figure 1D, with base congruence defined by ZF binding schematic (see Figure S1)).

