
Fig. 3.
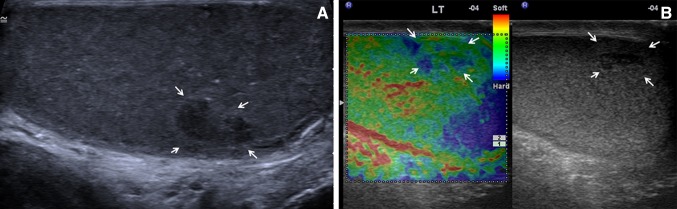
a A longitudinal grey-scale image of the left testis 7 days following the first examination demonstrating reduction in size of the lesion, with continuing central low echogenicity and surrounding increased echogenicity (arrows). b A longitudinal real-time elastography image of the lesion, (arrows) demonstrating a predominantly green signal, with areas of blue consistent with a “soft” lesion. A strain ratio was measured at 1.22 (not shown)