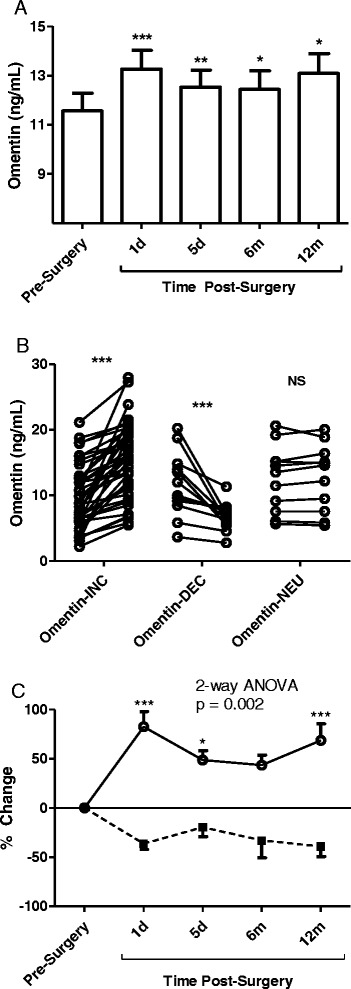
Figure 2.

Fasting pre-operative and post-operative Omentin levels. A: Fasting levels of Omentin were measured pre-operative, and at 1 day, 5 days, 6 months and 12 months post-operatively. Results are presented as average ± SEM with analysis by ANOVA vs pre-operative levels. B: Pre-operative and 1 day levels of Omentin are given individually for subjects separated based on >10% increase (OmentinINC), >10% decrease (OmentinDEC), and no change in Omentin (neutral = OmentinNEU). C: Percent Omentin change across all time points is given for the OmentinINC (solid line) and the OmentinDEC (dotted line) group. Results are presented as average ± SEM with analysis by 2-way ANOVA. Significance is presented as *p < 0.05, **p < 0.01 and ***p < 0.001.
