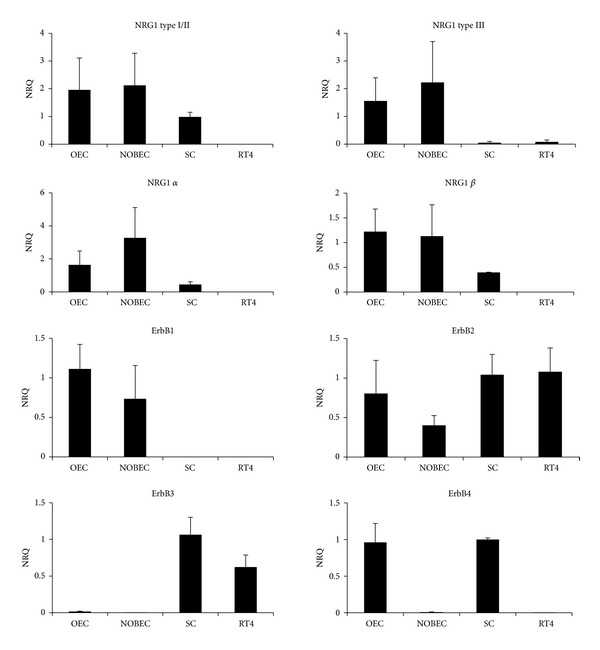
Figure 2.

Primary cultures and cell lines derived from OEC and SC express different levels of NRG1 isoforms and ErbB receptors. Graphs show normalized relative quantification (NRQ) of the different NRG1 isoforms and ErbB receptors obtained by qRT-PCR. For each gene, the cells with the highest level of expression were chosen as calibrator (NRQ = 1). Data are presented as mean + SEM.
