
Figure 1.
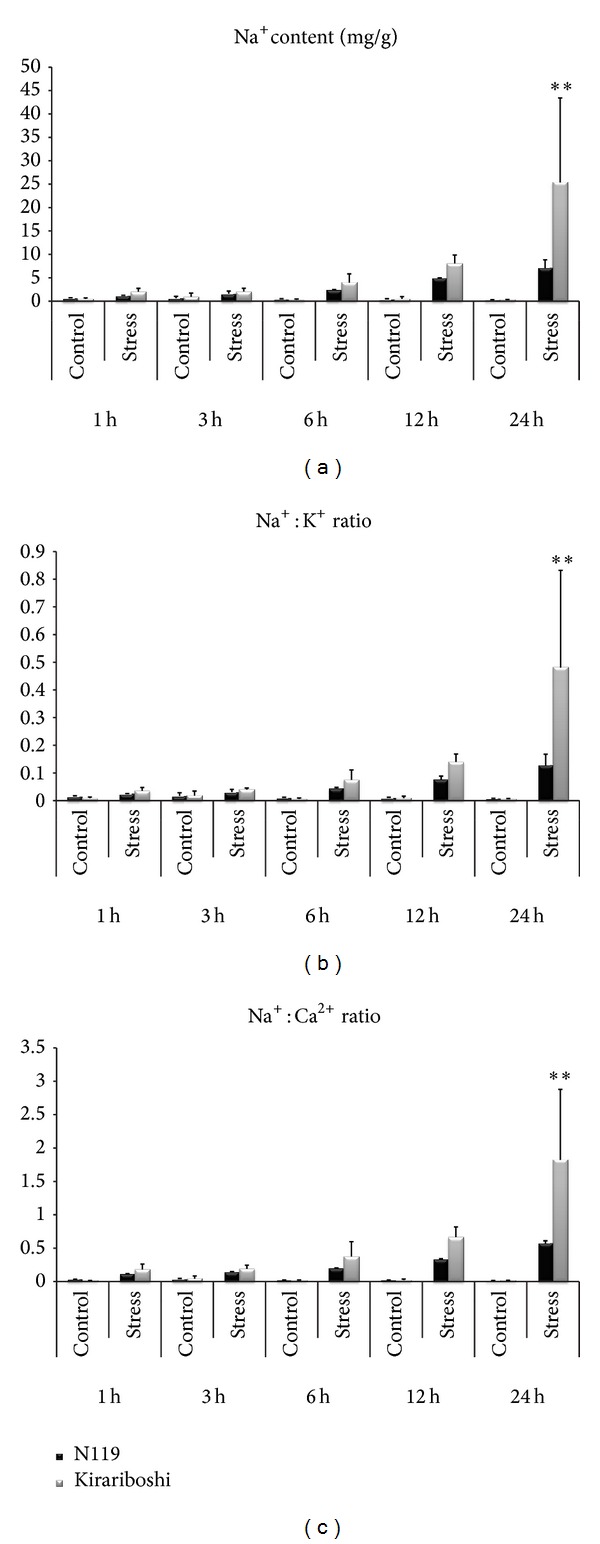
Ion contents in the leaves of B. napus in response to salt stress. Symbol “∗∗” indicates significant difference at P < 0.01 by t-test.
Official websites use .gov
A
.gov website belongs to an official
government organization in the United States.
Secure .gov websites use HTTPS
A lock (
) or https:// means you've safely
connected to the .gov website. Share sensitive
information only on official, secure websites.
Ion contents in the leaves of B. napus in response to salt stress. Symbol “∗∗” indicates significant difference at P < 0.01 by t-test.