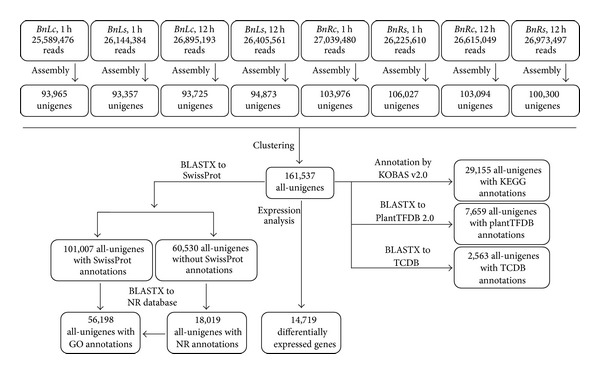
Figure 2.

Flowcharts of the transcriptome analysis for B. napus. The whole analysis involved sequencing assembly by Trinity and clustering by CD-HIT-EST, SwissProt/Nr annotation, GO annotation, KEGG annotation, aligning to PlantTFDB 2.0 and TCDB, and identification of DEGs as candidate salt-responsive genes.
