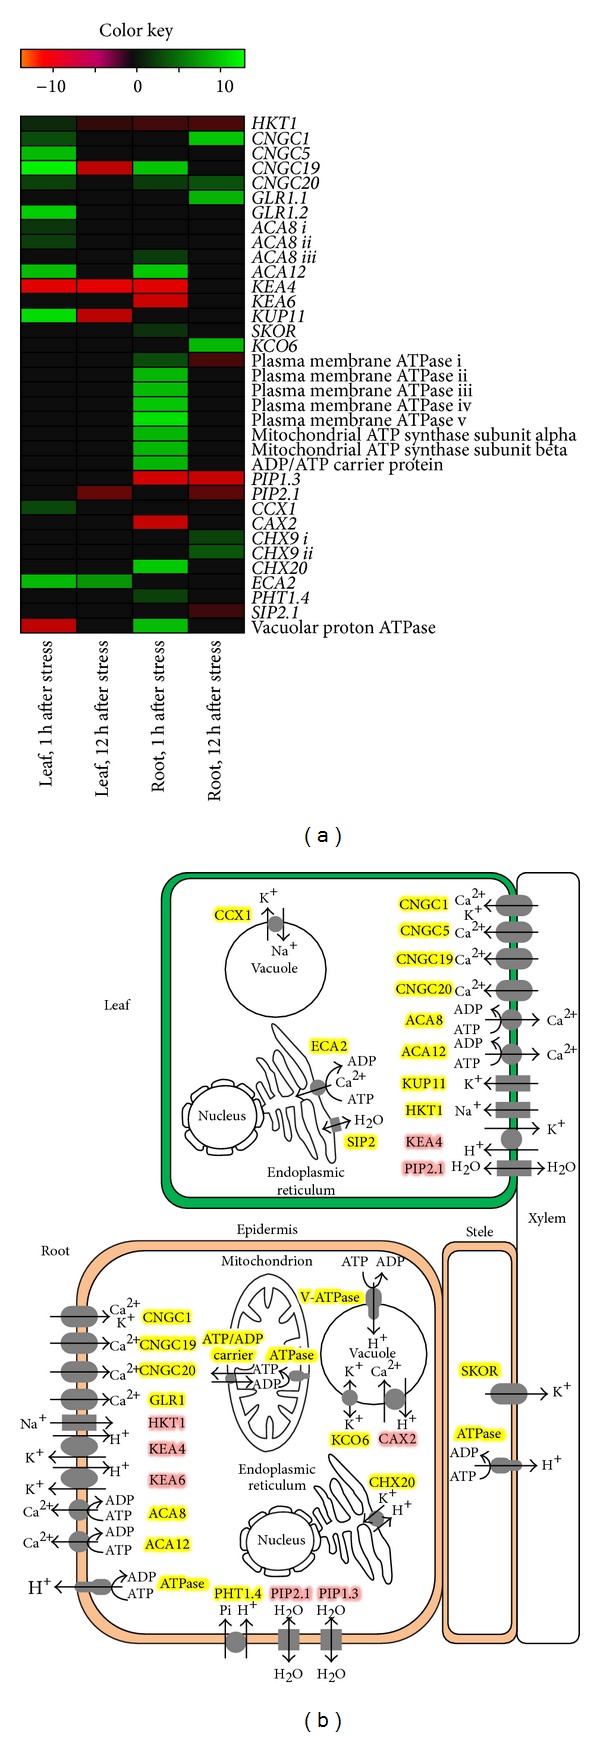
Figure 8.

Regulation of transporter genes during salt stress. (a) Heat map depicting log2 fold change of differential expression of transporter genes in B. napus. (b) Cellular localization and functions of the regulated transporter in response to salt stress. Genes highlighted in yellow indicate upregulation while those highlighted in red indicate downregulation.
