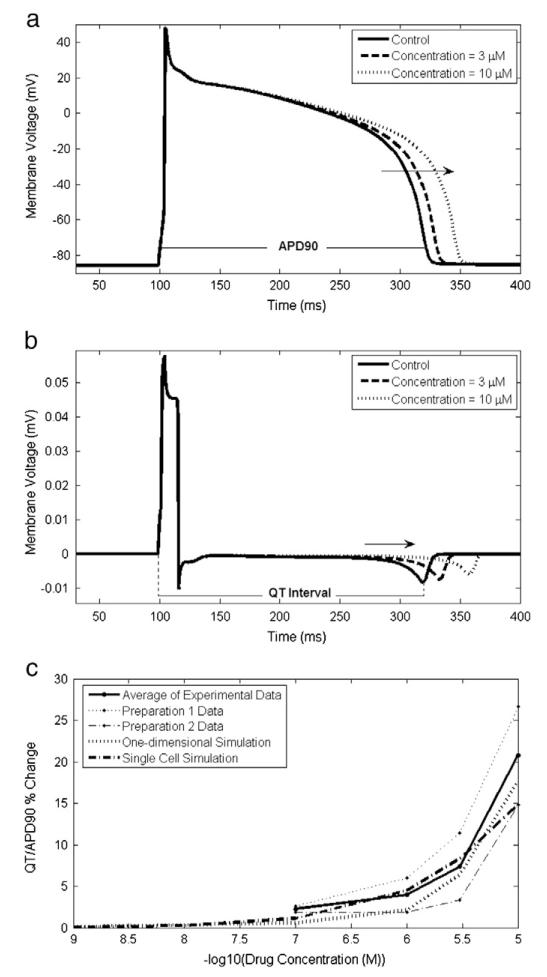
Fig. 1.
a) An action potential generated from a single cell simulation and b) a pseudo-ECG from a one-dimensional tissue simulation at a range of concentrations for compound 2659 (see Supplementary data). Simulations were performed using PatchXpress data, parameterising the drug block model with the IC50 value and Hill coefficient in the single cell simulation and with just the IC50 value (and assuming the Hill coefficient is 1) in the one-dimensional simulation. The intervals used for calculation of the APD90 value and QT interval from the simulated control result are indicated in a) and b). Arrows indicate the effect observed in the APD90 value/QT interval with increasing compound concentration. In c) the percent change in APD90/QT interval determined from the simulation results and experimental results (both individual preparation results and the average of these) in the rabbit ventricular wedge assay is plotted for comparison.

