Figure 4.

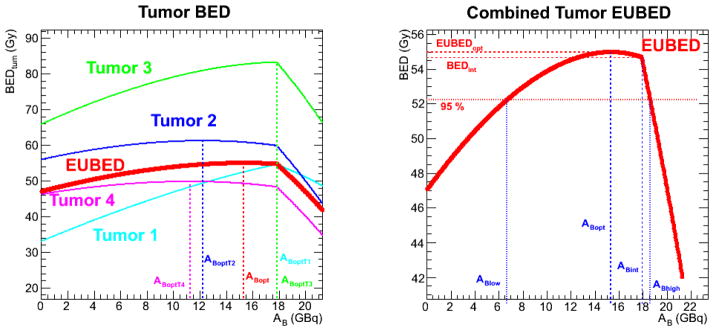
Multiple tumor optimization. Figure 4a shows the optimization for the tumors separately in different colors as well as for the EUBED (in red). Figure 4b shows a blow-up of the EUBED curve.

Multiple tumor optimization. Figure 4a shows the optimization for the tumors separately in different colors as well as for the EUBED (in red). Figure 4b shows a blow-up of the EUBED curve.