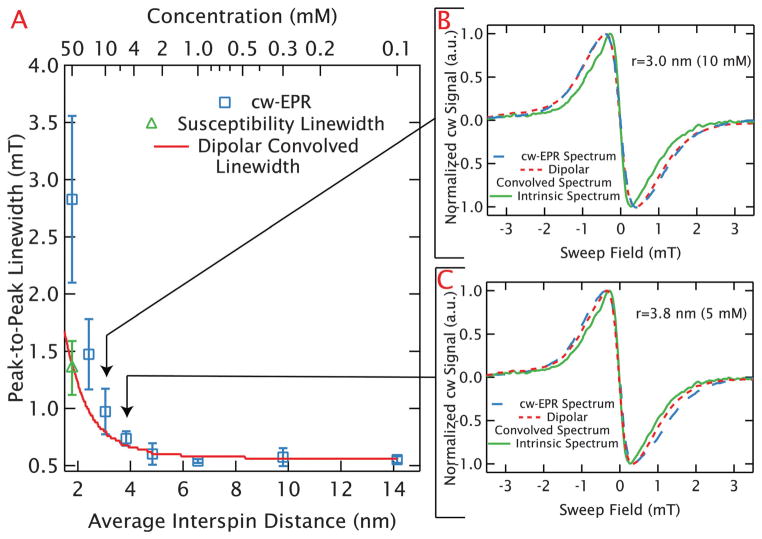
Fig. 3.
Distance limits of dipolar broadening in random solutions of GdCl3. (A) The measured peak-to-peak linewidths are plotted in blue squares as a function of average interspin distance for random, frozen solutions of GdCl3 at 10 K. The average values and error bars are determined from multiple measurements at each average nearest-neighbor distance. An uncertainty in the peak to peak linewidth for each experiment was estimated based on the resolution with which the peak could be determined (which depended largely on the sweep rates and noise). These uncertainties were used to carry out a weighted averaging of the measured linewidths to generate an average linewidth for each concentration. The error bar for each average linewidth was determined from the unbiased, weighted variance. The large error bars apparent at higher concentrations result from refractive broadening. The average best-fit value for the peak-to-peak linewidth after elimination of refractive broadening are shown with a green triangle for r̄ = 1.8 nm (50 mM). As with the experiments, the average value and error bar result from a weighted average and the unbiased, weighted variance respectively (based on uncertainties determined from the error landscape of the correction). The linewidths from the dipolar-convolved spectra are shown with the red line and agree well with the narrowest linewidths measured up to r̄ = 3.0 nm (10 mM). (B) and (C) Confirm this by demonstrating the narrowest experimental lineshape (blue, dashed line) and dipolar-convolved lineshape (red, dotted line) agree well at r̄ = 3.0 nm (10 mM) and r̄ = 3.8 nm (5 mM). Each plot includes the intrinsic linewidth (the experimental r̄ = 14.3 nm (100 μM) spectrum) as a solid green line.

