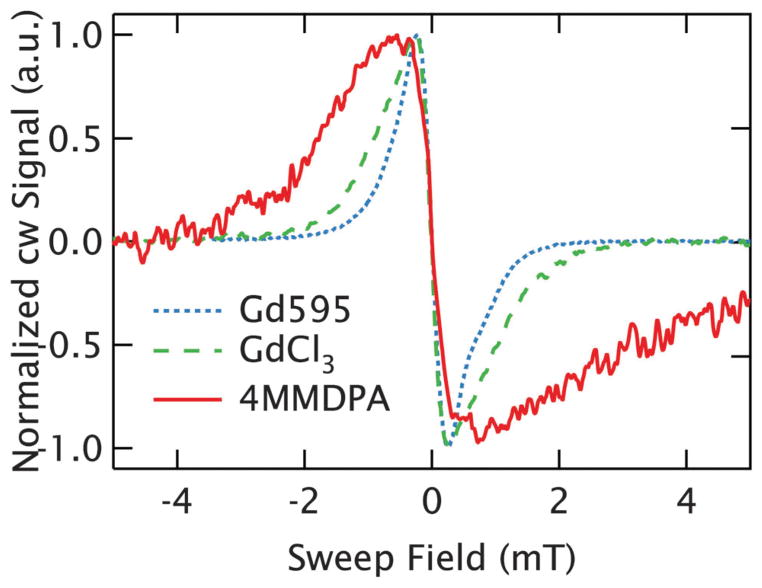
Fig. 6.
Intrinsic linewidth of Gd3+ chelates. The cw EPR spectra compare the central transition of Gd3+ at 1 mM (r̄ = 6.6 nm) in three different coordinating environments. Gd595 is plotted as a dotted blue line, and shows a linewidth slightly narrower than freely dissolved GdCl3 (dashed green line), where the Gd3+ is coordinated by the solvent. 4MMDPA, plotted as a solid red line, shows a linewidth nearly twice as broad as the others.

