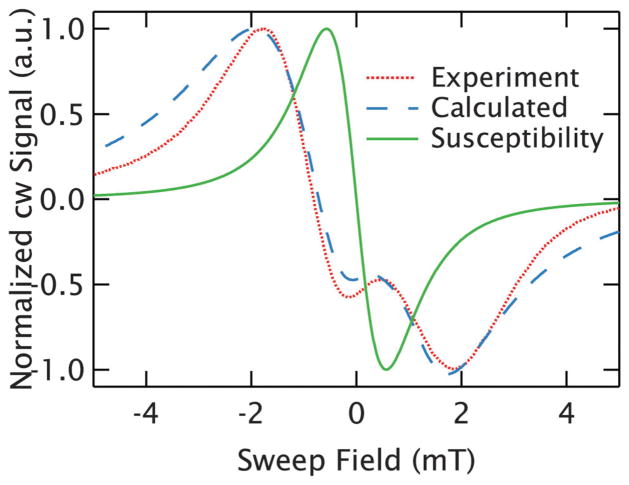
Fig. 9.
Eliminating the effects of refractive broadening. The complex lineshape of an r⃗ = 1.8 nm (50 mM) GdCl3 sample (spectrum 3 of Fig. 4) is plotted as a dotted, red line and can be well described by accounting for the effects of refractive broadening in a simple calculation of the resonance (dashed, blue line). This allows the determination of the true width of the resonance from the susceptibility response, which is shown with the solid, green line and demonstrates how dramatically the refractive broadening artificially broadens the measured lineshape at high concentration.

