
Figure 4.
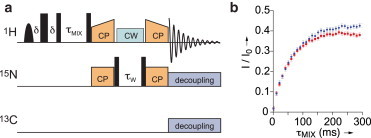
(A) Pulse sequence for the proton-detected water-edited 1D 15N-1H CP-HSQC experiment. Narrow and broad black rectangles indicate π/2 and π pulses, respectively, and the bell shape represents a band-selective water excitation pulse. (B) Buildup curves representing the relative intensities of the water-edited CP-HSQC spectra compared with the standard 15N-1H CP-HSQC spectra of amide protons. Curves obtained on intact and cleaved MeV nucleocapsids are represented in blue and red, respectively. Experiments were carried out on a 1 GHz spectrometer equipped with a triple-channel 1.3 mm probe at 60 kHz MAS. To see this figure in color, go online.