
Figure 4.
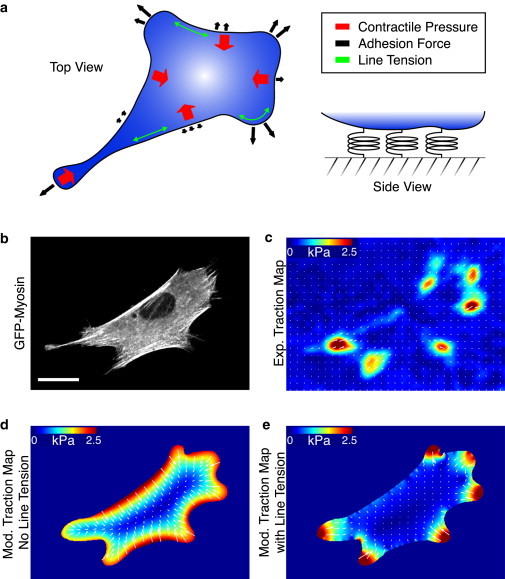
Model of unconstrained fibroblasts. (a) A force-balance diagram illustrating the components in the model, including an isotropic contractile pressure throughout the cell, uniform line tension along the periphery, and the adhesion force dependent on local boundary curvature. (b) A cell expressing GFP-myosin on an 8-kPa polyacrylamide substrate uniformly coated with fibronectin. Scale bar is 20 μm. (c) Experimental traction map for the cell in panel b. (d) The traction map produced by a model of a uniformly contracting gel without including a line tension, σa = 7 kPa and fm = 0. (e) The traction map produced from the model of the cell as a contractile gel with a uniform line tension, σa = 2.4 kPa and fm = 0.7 nN/μm. Other model parameters: Ecell = 5.4 kPa and ν = 0.43. To see this figure in color, go online.