
Figure 3.
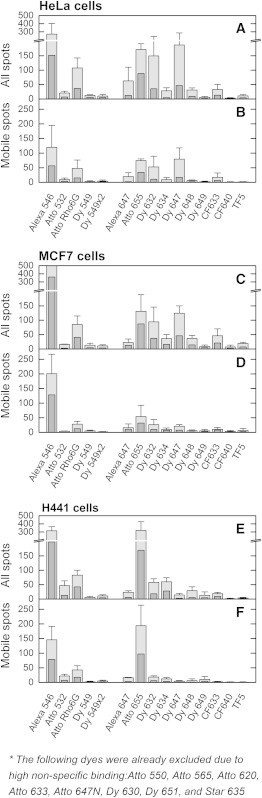
Quantification of the nonspecific binding of SNAP-tag fluorescent substrates in live cells. The values show the number of mobile fluorescent substrates and the total number of fluorescent substrates (mobile and immobile) that were nonspecifically bound to cells. The values were determined per field of view area in HeLa, MCF7, and H441 cell lines for each dye showing nonspecific binding on the single-molecule level. Some dyes had extremely high levels of nonspecific binding, and since no individual spots could be detected, these were excluded from this graph. Shown are the average number of molecules detected in frame numbers 20–40 (light gray) and 120–140 (dark gray). The field of view is a circular area (1520 μm2) with a radius of ∼22 μm. The values were determined in multiple recordings, and the average number is shown here, with the error representing the sample standard deviation.