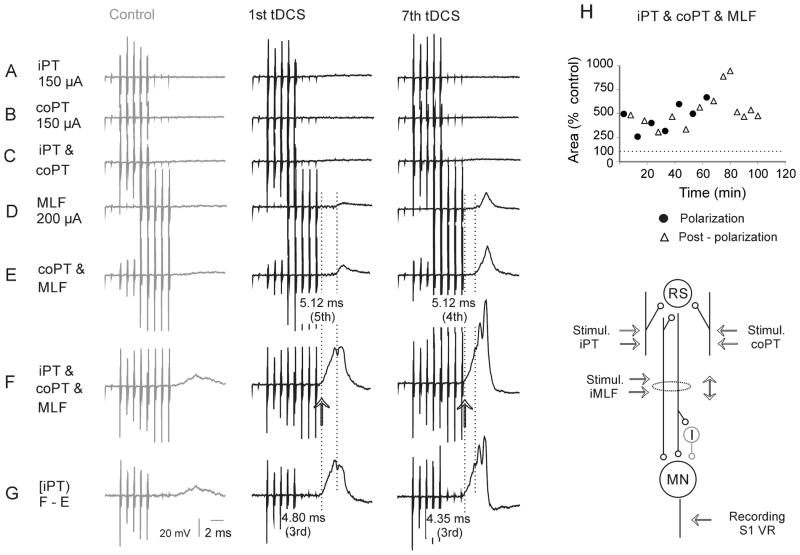
Figure 7. Examples of activation of motoneurons (VR discharges) by iPT, coPT and MLF stimulation after tDCS.
(A–F), Averaged records (n=20) of discharges of motoneurons in the S1 VR evoked by different combinations of iPT, coPT and MLF stimuli, as indicated to the left, after but not before tDCS. Left panels, control records. Middle and right panels, records during the first minute of the first and seventh periods of application of tDCS. (G), Addition of effects from iPT when stimulated together with coPT and MLF (records from row (F) minus records from row (E). Dotted vertical lines indicate the onset of discharges evoked at shortest (in F and G) and longest (in D and E) latencies. Note increase in amplitude of both the earliest and later components of VR discharges and shortening of latencies of discharges evoked by the most efficient combinations of the stimuli during tDCS. Note also that the earliest discharges after tDCS were evoked during the time window between the two dotted lines in (D–G) during which no discharges were evoked by either MLF or coPT stimuli; iPT stimulation must have been responsible for these early responses. (H), time course of changes in the areas of records of ventral root discharges following combined stimulation of MLF preceded by stimulation of both iPT and coPT, i.e. records illustrated in row (F). The measurements were made during the time window between the two dotted lines in (D–G). Ordinate, areas in % of control areas; abscissa, time in minutes from the beginning of the first period of tDCS. Dotted horizontal line indicates the original area. The diagram indicates the sites of recording and stimulation and the underlying convergence of iPT, co PT and MLF fibres on reticulospinal neurons discharging the motoneurons, either directly or via spinal interneurons.

