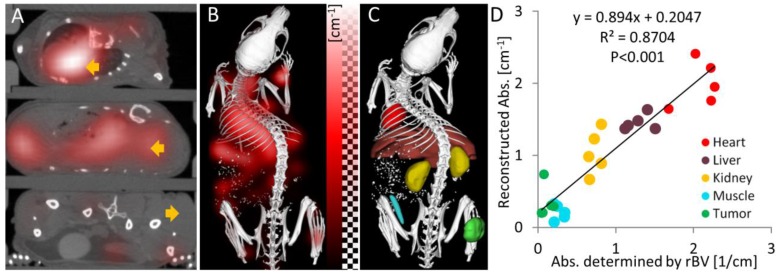
Figure 4.
Absorption reconstruction in vivo. (A) Axial slices through the heart, liver and tumor (arrows) showing the absorption as red overlay. High absorption appears in the heart and the liver while the absorption in the tumor is low. (B) 3D rendering shows high absorption in the upper torso, where the heart and the liver reside. (C) Segmented regions (heart, liver, kidney, muscle and tumor) used to quantify the optical absorption. (D) Correlation of reconstructed organ absorption with the absorption determined from the relative blood volume (rBV). The same colors are used for the tissue regions as in (C). The strong correlation shows that the absorption map can be reconstructed quantitatively.

