Figure 7.
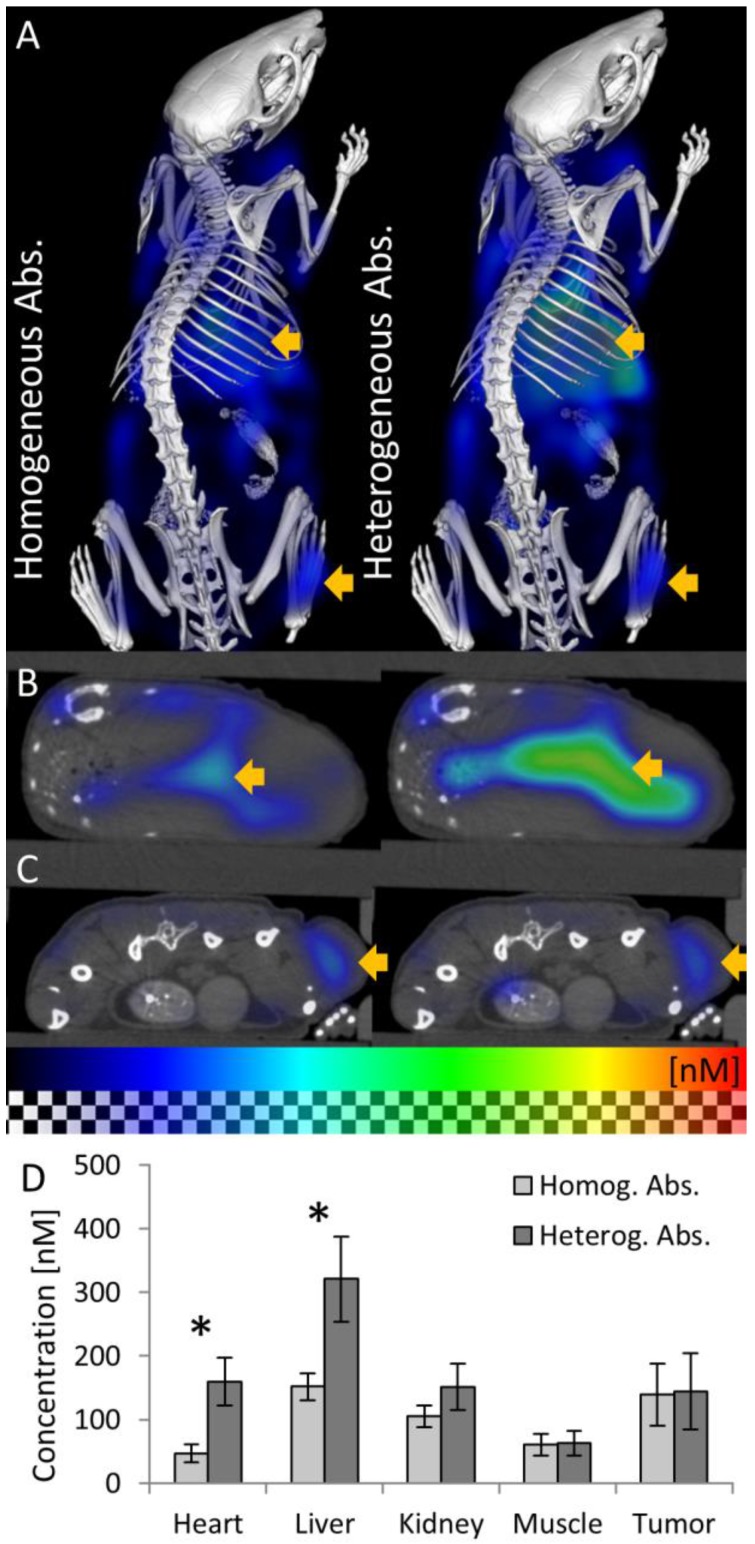
Fluorescence in vivo 48h after injection. (A) 3D renderings of reconstructed fluorescence distribution. Left: Reconstruction using homogeneous absorption. Right: Reconstruction using heterogeneous absorption. High signal appears in the liver and tumor (arrows). (B) Transversal slice through the liver (arrow). (C) Slice through the subcutaneous tumor (arrow), 48 h after i.v. injection, showing high fluorescence concentration caused by passive probe accumulation. (D) Usage of the absorption map avoids underestimation of fluorescence in strongly absorbing organs such as heart and liver but hardly affects muscle and tumor (* indicates P<0.05).

