
Figure 2.
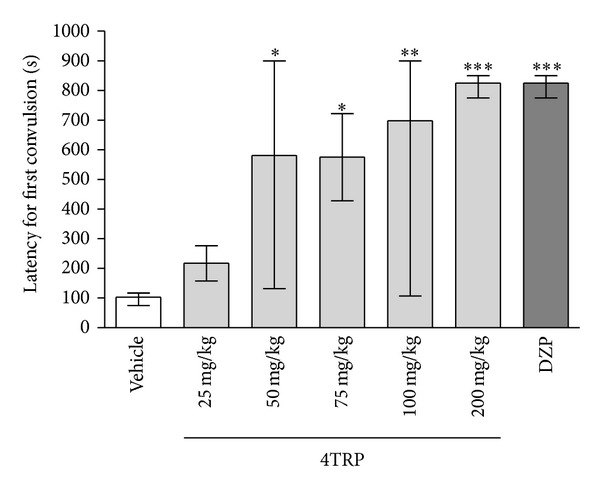
Effect of 4TRP on the latency to the development of PTZ-induced convulsions in mice. The values represent the median and interquartile ranges. One-way ANOVA/Dunn's test, ∗P < 0.05, ∗∗P < 0.01, ∗∗∗P < 0.001 compared with control values.
Official websites use .gov
A
.gov website belongs to an official
government organization in the United States.
Secure .gov websites use HTTPS
A lock (
) or https:// means you've safely
connected to the .gov website. Share sensitive
information only on official, secure websites.
Effect of 4TRP on the latency to the development of PTZ-induced convulsions in mice. The values represent the median and interquartile ranges. One-way ANOVA/Dunn's test, ∗P < 0.05, ∗∗P < 0.01, ∗∗∗P < 0.001 compared with control values.