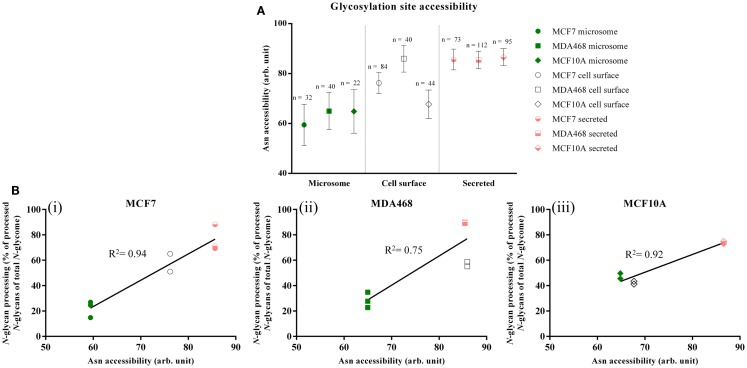
Figure 3.
(A) Glycosylation site accessibilities (unit-less, arbitrary values, mean ± SEM) of the microsomal (green), cell-surface (white), and secreted (light red) proteins derived from MCF7, MDA468, and MCF10A breast epithelial cell lines. (B) Correlation between the site accessibilities and the N-glycosylation processing as measured by the more processed N-glycan types (hybrid, complex, and paucimannose) as a molar proportion of the total N-glycome for the three subcellular fractions. High correlation coefficients (R2) indicate strong correlation.

