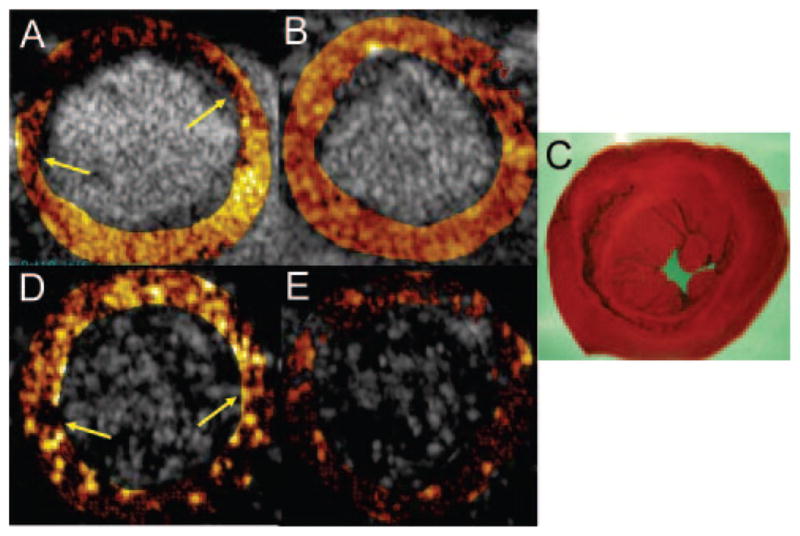
Figure 3.

Ischemic memory imaging at 30 minutes after reflow in 1 rat undergoing 15 minutes of ischemia but sustaining no infarction (C). The myocardial contrast echocardiograms are represented as subtraction images, with values for contrast change color-coded for each pixel. The risk area during occlusion (contrast-deficient region between arrows in A) resolves after reperfusion (B). For the MCE images in D and E, the image at 4 minutes after contrast injection has been subtracted from the 3.5-minute image to yield the signals attributable to adhesion. After injection of sLex-conjugated microbubbles, there is persistent contrast enhancement (region between arrows in D) within the previously ischemic area (A), which is not seen after injection of control microbubbles (E).
