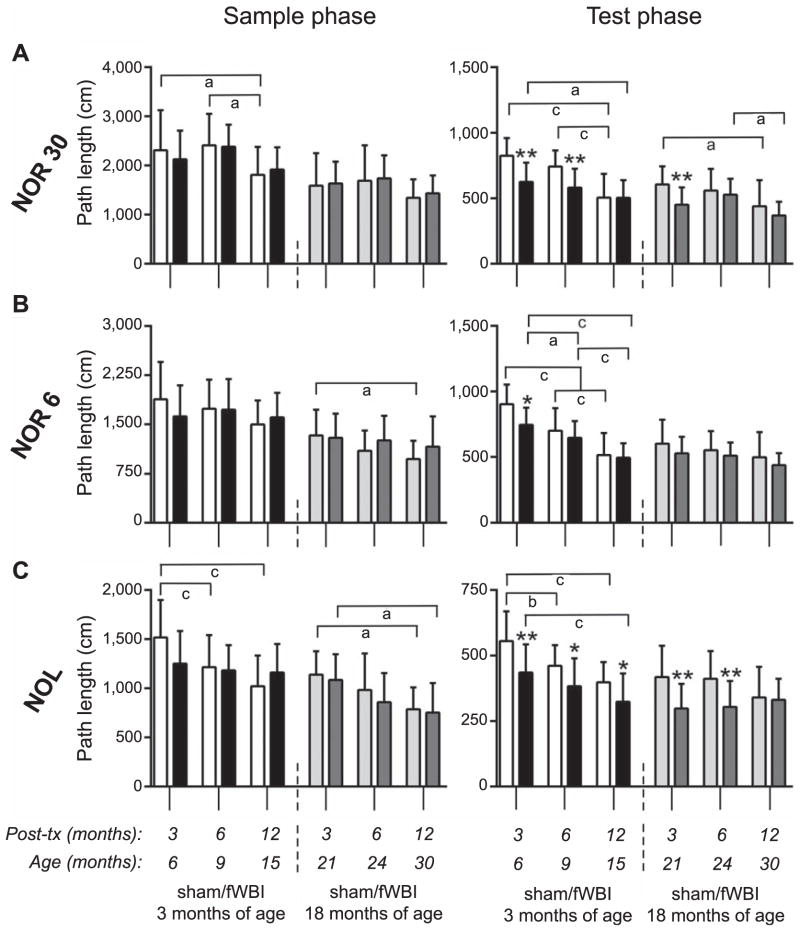
FIG. 3.
Movement. The length of the path (mean + SD) traversed by rats in the sample and test phase of each task are plotted for groups of rats irradiated (black and dark gray bars) or sham-irradiated (open and light gray bars) at either 3 or 18 months of age and tested in the NOR 30, NOR 6 and NOL at 3, 6 and 12 months after treatment. Y-axis scaling is relative to the total duration of the task phase. *P < 0.05 and **P < 0.01 vs. age-matched, sham-irradiated control; aP < 0.05, bP < 0.01 and cP < 0.005 for indicated age comparison within treatment group.

