Fig. 3.
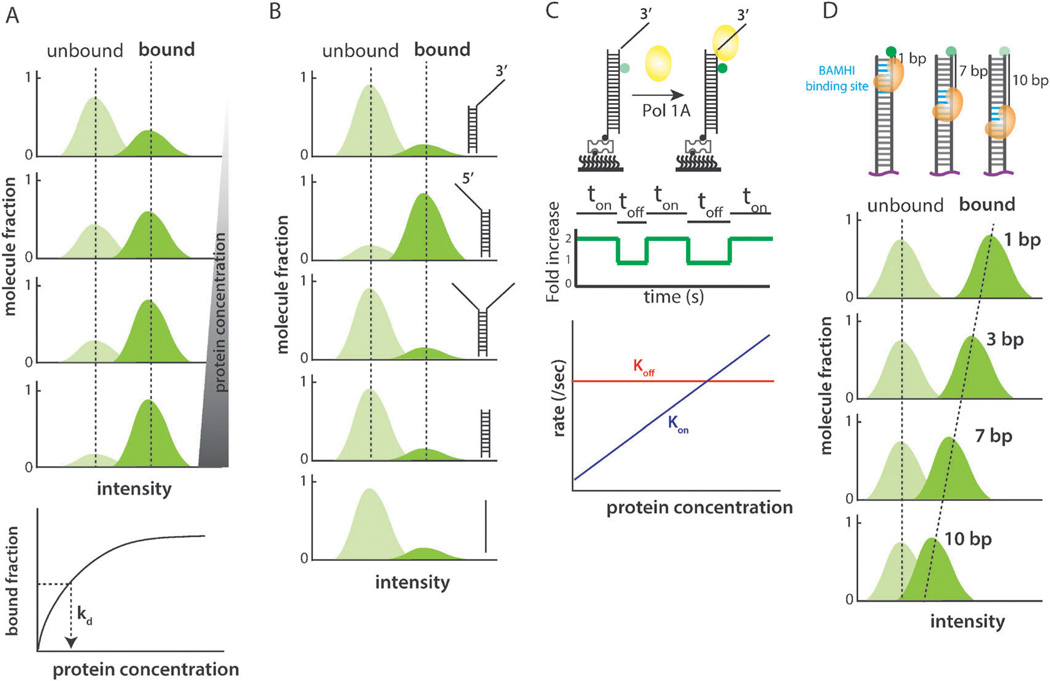
(A) Fluorescence intensity histograms collected from various protein concentrations. The bound fraction plotted as a function of protein concentration to extract the dissociation constant, Kd. (B) Fluorescence intensity histograms collected for different substrates to test a given protein’s binding specificity. (C) When Pol1A binds, fluorescence intensity increases. Dwell times, ton and toff, can be collected, inversed, and plotted as rates, kon and kofif (D) Fluorescence intensity histograms can provide details on approximate binding position of a given protein.

