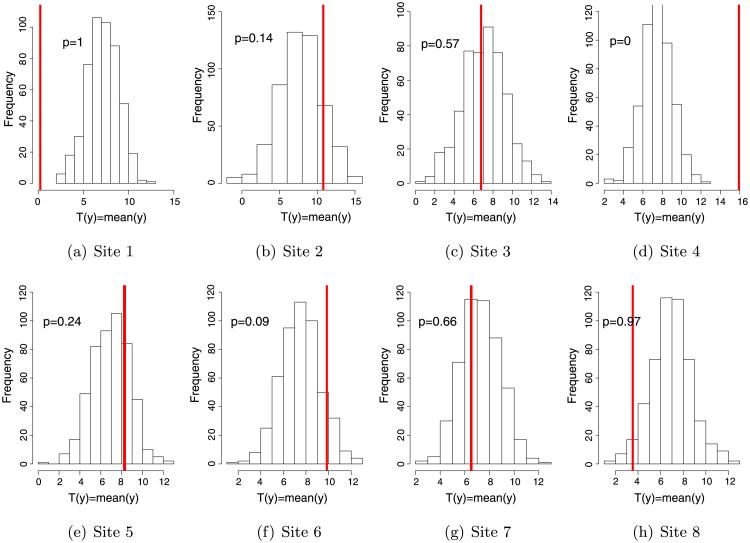
Figure 3.
Histogram of posterior distribution of site-specific means simulated from the complete-pooling model. Each panel shows the histogram of posterior distribution of the test quantity (mean) at each site. The vertical red line indicates the observed value of the test quantity at each site. The legend shows the tail probability of the observed value.

