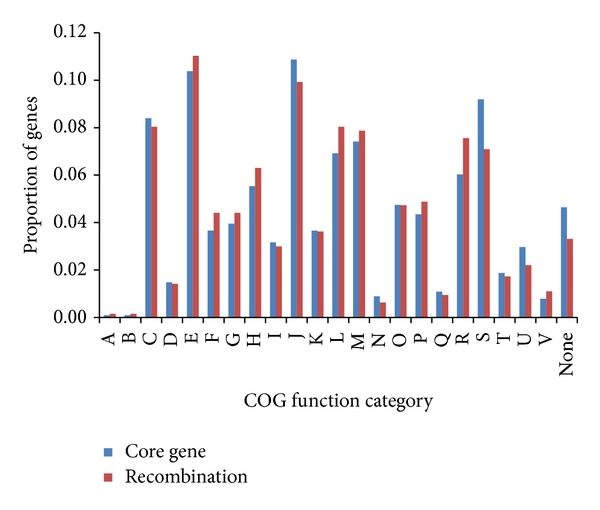
Figure 2.

Genes with recombination signals are distributed with no significance in all COGs. The x axis represents different COG categories. The y axis represents the proportion of genes in each COG category. The proportion of genes with evidence for recombination and core genes for each COG are represented by red and blue bars, respectively. The COG categories are coded as follows: A, RNA processing and modification; B, chromatin structure and dynamics; C, energy production and conversion; D, cell cycle control, cell division, and chromosome partitioning; E, amino acid transport and metabolism; F, nucleotide transport and metabolism; G, carbohydrate transport and metabolism; H, coenzyme transport and metabolism; I, lipid transport and metabolism; J, translation, ribosomal structure and biogenesis; K, transcription; L, replication, recombination, and repair; M, cell wall/membrane/envelope biogenesis; N, cell motility; O, posttranslational modification, protein turnover, and chaperone; P, inorganic ion transport and metabolism; Q, secondary metabolites biosynthesis, transport, and catabolism; R, general function prediction only; S, function unknown; T, signal transduction mechanisms; U, intracellular trafficking, secretion, and vesicular transport; V, defense mechanisms; None, not in COGs.
