
Figure 5.
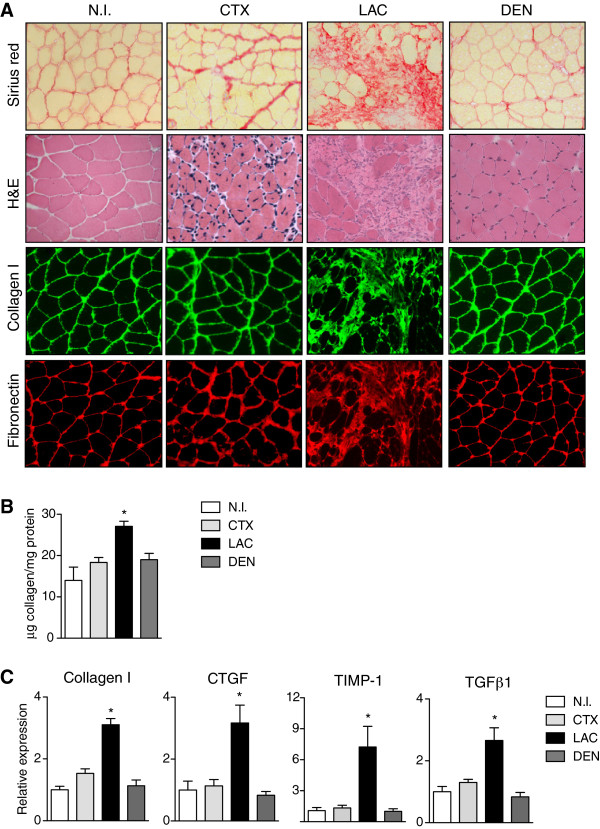
Quantification of muscle fibrosis after chemical and surgical damage in wild-type mice. (A) Sirius red, hematoxylin and eosin (H&E), collagen I (green) and fibronectin (red) staining on wild-type (WT) tibialis anterior (TA) muscles two weeks after cardiotoxin (CTX) injury (50 μl of 10–5 M), laceration (LAC) and denervation (DEN) compared to non-injured (NI) muscle of sham-operated WT mice. (B) Quantification of collagen content in WT muscle after different injuries. Data correspond to the mean ± SEM; n = 4 on each group. Non-parametric Mann–Whitney U test; *P <0.05 versus NI. (C) Quantitative RT-PCR for collagen I, connective tissue growth factor (CTGF), tissue inhibitor of metalloproteinases 1 (TIMP-1) and transforming growth factor beta 1 (TGFβ1) mRNA in muscles after the different injuries (values are means ± SEM; n = 4 on each group. Non-parametric Mann–Whitney U test; *P <0.05 versus NI). Scale bar = 50 μm.