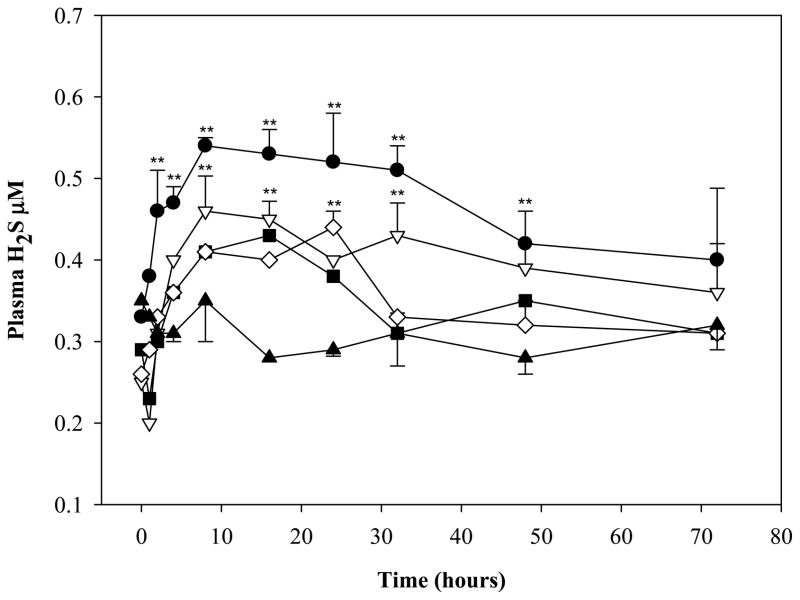
Figure 3.
Levels of plasma hydrogen sulfide in rats treated ip with a single administration of 1 (black square), 2 (white diamond), 5 (white triangle down), 10 (black circles) mg/kg ADT. Control rats were treated with vehicle (black triangles, DMSO). Data represent mean of 4 animals per treatment; SD and statistical significance were omitted for some data points for graphical reasons. **indicates p<0.01 vs vehicle.

