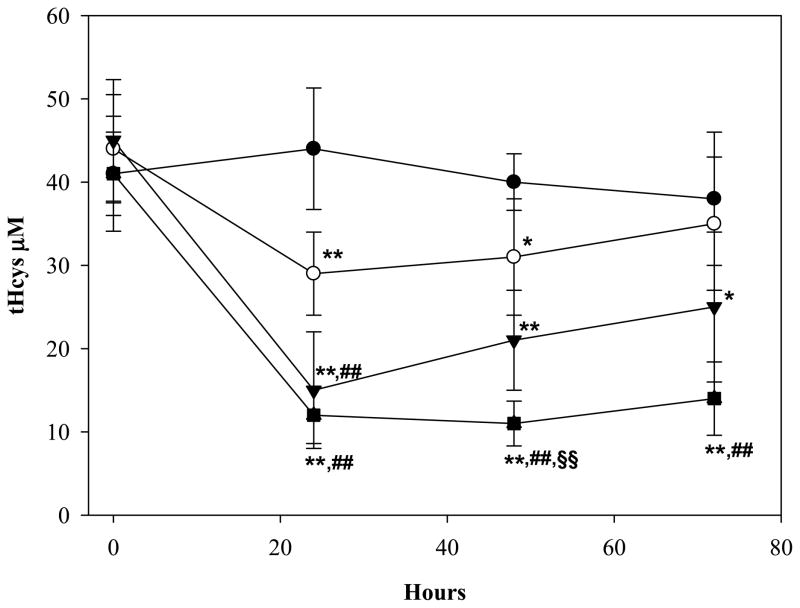
Figure 6.
Plasma levels of tHcys in rats fed with a Met enriched diet. After achieving stable tHcys levels, the rats received a single ip injection of 0 (dark circle), 2 (white circle), 5 (dark triangle), or 10 mg/kg (dark square) ADT. Levels of tHCys are shown at baseline and 24, 48, 72h after ADT injection. Data represent mean ± SD of 4 animals per treatment; * indicates p<0.05 ADT vs. control rats; ** indicates p<0.01 ADT vs. control rats; ## indicates p<0.01 ADT vs. the lowest dose ADT; §§indicates p<0.01 ADT vs. intermediate dose of ADT.

