
Figure 1. Interpreting mixed insulin signals.
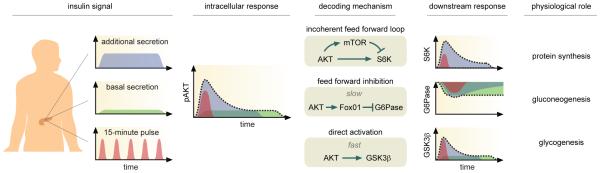
Three patterns of insulin dynamics have been observed in vivo: additional secretion in response to meals; basal secretion during low glucose uptake; and 10-15 minute pulses. These dynamical responses are captured simultaneously in the temporal pattern of pAKT. According to model predictions, the intracellular activity of pAKT is decoded by the kinetics and connectivity of the downstream signaling network. An incoherent feed forward loop structure triggers rapid activation followed by delayed inhibition of S6K. This architecture allows S6K to sense changes in pAKT and ensures that S6K returns to the same level. G6Pase is activated through an inhibitory feed forward structure with slow kinetics but high sensitivity to pAKT. These properties allow G6Pase to filter out transient fluctuations in the input signal. GSK3β, which is controlled by direct activation, reproduces all dynamical features of AKT. For downstream responses, dotted lines represent the combined dynamical behavior in response to multiple insulin signals layered onto pAKT simultaneously; shaded trajectories represent the different components resulting from the distinct patterns of insulin dynamics.