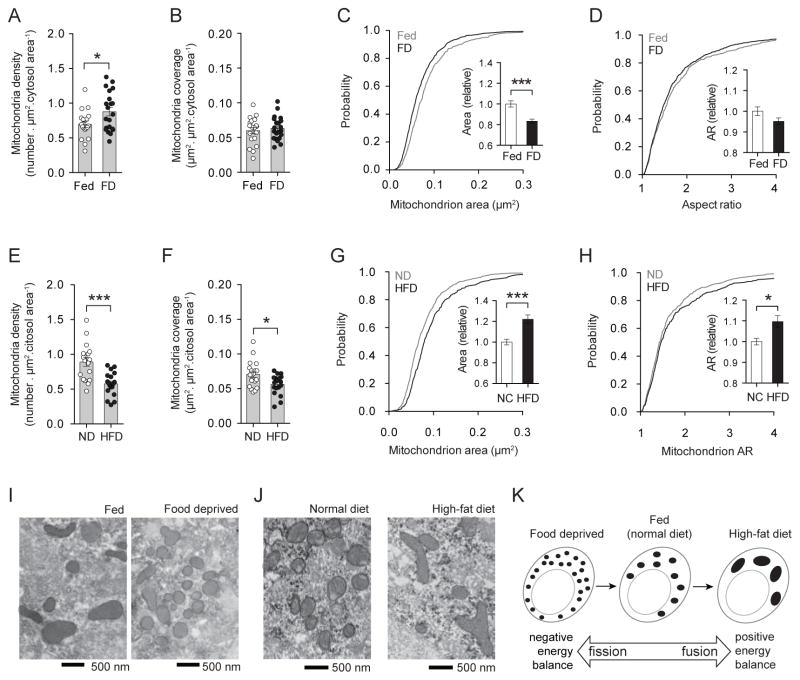
Figure 2. Mitochondria fusion-fission in Agrp neurons varies with metabolic status.
(A) Mitochondria density, and (B) mitochondria coverage in Agrp neurons from fed and 24h food deprived (FD) mice. (C) Cumulative probability distribution of cross-sectional mitochondria area in Agrp neurons of fed and FD mice; insert, relative change in mean mitochondria area between fed and FD mice. (D) Cumulative probability distribution of the aspect ratio (AR) of mitochondria in Agrp neurons; insert, relative changes in mean AR between fed and FD mice. N (fed) = 527 mitochondria/19 cells/4 mice; N (FD) = 729 mitochondria/21 cells/4 mice. (E–H) Differences in mitochondria parameters between mice fed normal chow diet (ND) and a HFD similarly to (A–D). N (ND) = 629 mitochondria/18 cells/3 mice; N (HFD) = 417 mitochondria/18 cells/3 mice. (I) Representative electron micrographs of mitochondria profiles in Agrp neurons from fed and FD mice. (J) Similar to (I), mitochondria labeled in Agrp neurons of mice fed ND or a HFD. (K) Schematic showing the transition from negative energy balance to positive energy balance, and the concomitant changes in mitochondria fusion-fission. All mice were male. Bars represent mean ± SEM. Symbols represent individual values. * P < 0.05, *** P < 0.001. See also Figures S1 and S2.

