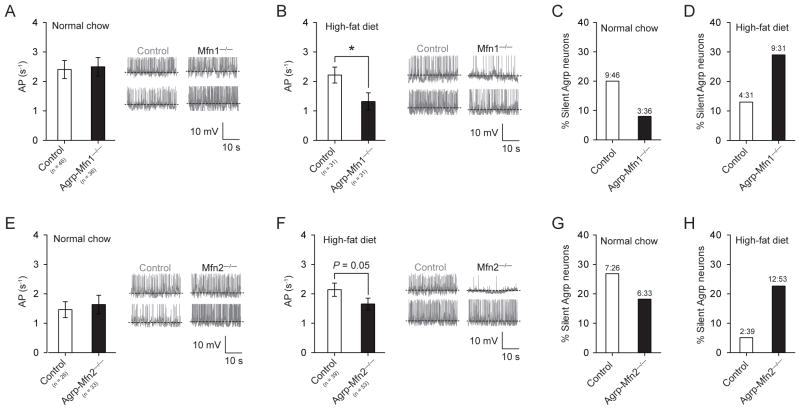
Figure 5. Mitochondria fusion regulates the electrical activity of Agrp neurons in response to high-fat feeding.
(A, E) In normal chow conditions, both control and Agrp-Mfn1−/− or Mfn2−/− neurons have similar frequency of action potential (AP) as recorded using slice whole-cell recording. (B, F) When mice were fed a HFD, Agrp-Mfn1−/− or Mfn2−/− neurons have decreased AP frequency compared to control cells. (C, G) Percentage of silent Agrp neurons in control and Agrp-Mfn1−/− or Mfn2−/− mice fed a normal chow diet. (D, H) In HFD, increased percentage of silent Agrp neurons in both Agrp-Mfn1−/− and Agrp-Mfn2−/− mice compared to control mice (P < 0.05, Fisher’s test). Data are pooled from both male and female mice. In A, B, E and F bars represent mean ± SEM. In C, D, G and H bars represent absolute values. Representative traces are plotted in panels A–B, E–F. * P < 0.05. See also Figure S4.

