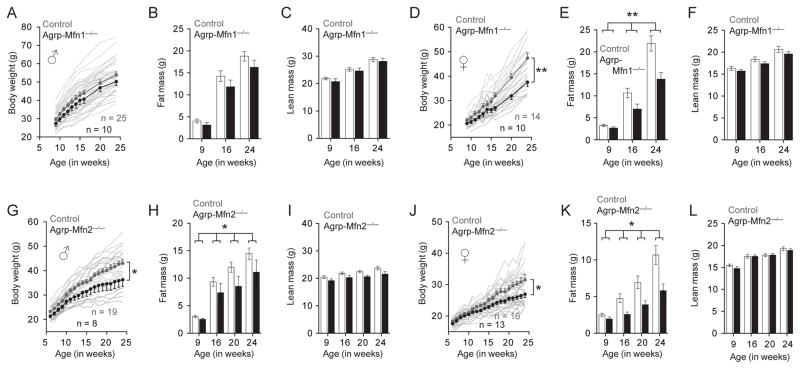
Figure 7. Metabolic response of Agrp-Mfn1−/− and Agrp-Mfn2−/− mice to diet-induced obesity.
(A) Body weight curve of control and Agrp-Mfn1−/− male mice. (B) Fat mass and (C) lean mass in the same animals as measured by MRI. (D–F) Similar to (A–C), but data correspond to female mice. A–C, n = 25 (control) and n = 10 (Mfn1−/−); D–F, n = 14 (control) and n = 10 (Mfn1−/−). (G–L) Similar to (A–F), data correspond to control and Agrp-Mfn2−/− mice fed a HFD. G–I, n = 19 (control) and n = 8 (Mfn2−/−); J–L, n = 16 (control) and n = 13 (Mfn2−/−). In A, D, G and J symbols represent mean ± SEM; shadow lines represent individual mouse body weight curve. Bars represent mean ± SEM. * P < 0.05, ** P < 0.01. See also Figures S5–S7.

