
Figure 3.
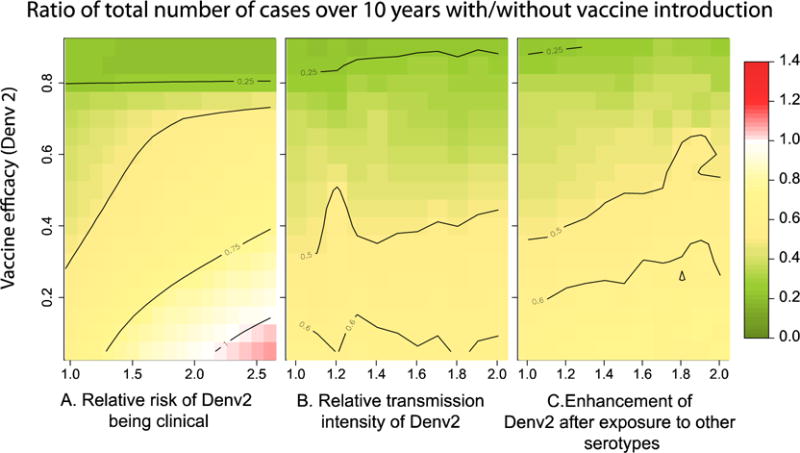
Figure summarizing the expected 10-year impact of vaccination with a partially effective vaccine under different scenarios. Each grid cell represents the ratio of the cumulative number of dengue cases 10 years after vaccine introduction, vs. the cumulative number of cases in the same 10 years, had the vaccine not been introduced. We performed simulations over a wide range of vaccine efficacies (for DENV-2) and A) relative risk of DENV-2 being clinical, B) relative transmission intensity of DENV-2, C) enhancement/inhibition of transmission intensity of secondary infections by DENV-2 (after prior primary exposure by any of the other serotypes). For all simulations we assumed the efficacy of the vaccine against other circulating serotypes to be 0.8.