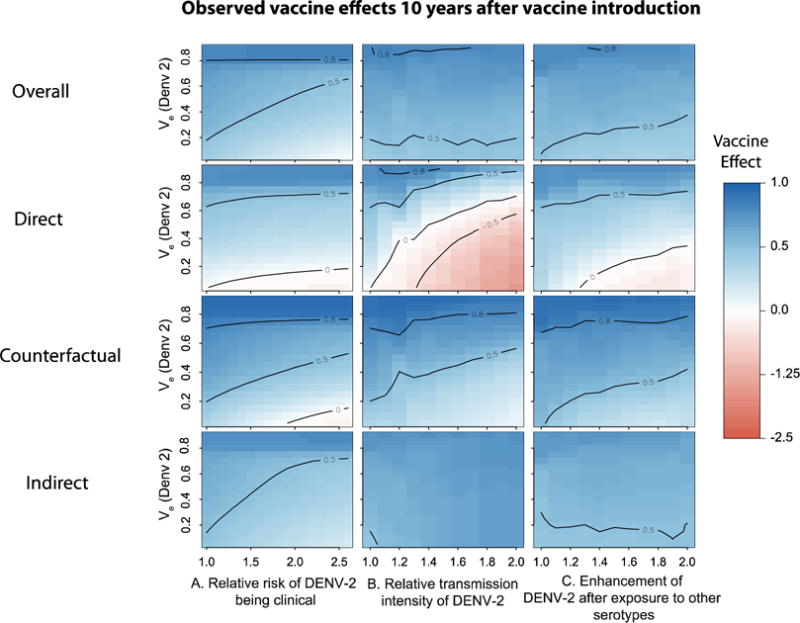
Figure 4.

Figure summarizing the expected 10-year vaccine effects of a partially effective vaccine under different scenarios. We performed simulations over a wide range of vaccine efficacies (for DENV-2) and sources of heterogeneity in A) relative risk of DENV-2 being clinically apparent, B) relative transmission intensity of DENV-2, C) enhancement/inhibition of transmission intensity of secondary infections by DENV-2 (after prior primary exposure to any of the other serotypes). See methods for description of effects. Each grid cell represents the 10-year population vaccine effect for that particular scenario. For all simulations we assumed the efficacy of the vaccine against other circulating serotypes to be 0.8.
