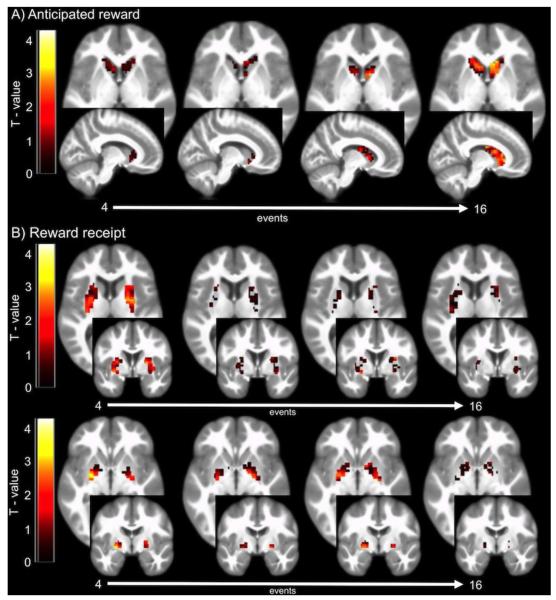
Figure 3.
Mean BOLD response to A) cues that signal impending palatable food receipt and B) palatable food receipt over repeated exposures in one fMRI session. As shown with changes in BOLD response over 4 learning periods (16 total events) in specified region of interest. The color bar represents the T-value of activity over the scan showing: A) increases in caudate responsivity to cue predicting milkshake receipt > cue predicting tasteless solution receipt, and B) decreases in putamen (middle row) and ventral pallidum (bottom row) responsivity to milkshake receipt > tasteless solution receipt.

